
 Yahoo Finance
 Tennant (NYSE:TNC) Might Be Having Difficulty Using Its Capital Effectively
If we want to find a stock that could multiply over the long term, what are the underlying trends we should look for? Typically, we'll want to notice a trend of growing return on capital employed (ROCE) and alongside that, an expanding base of capital employed. Ultimately, this demonstrates that it's a business that is reinvesting profits at increasing rates of return. However, after investigating Tennant (NYSE:TNC), we don't think it's current trends fit the mold of a multi-bagger.
Understanding Return On Capital Employed (ROCE)
For those who don't know, ROCE is a measure of a company's yearly pre-tax profit (its return), relative to the capital employed in the business. To calculate this metric for Tennant, this is the formula:
Return on Capital Employed = Earnings Before Interest and Tax (EBIT) ÷ (Total Assets - Current Liabilities)
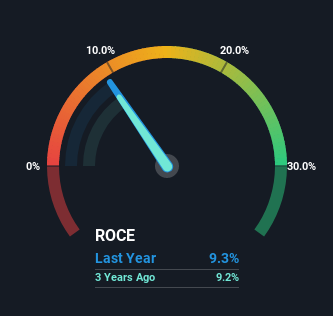
0.093 = US$73m ÷ (US$1.1b - US$266m) (Based on the trailing twelve months to March 2022).
So, Tennant has an ROCE of 9.3%. On its own, that's a low figure but it's around the 9.9% average generated by the Machinery industry.
Check out our latest analysis for Tennant
In the above chart we have measured Tennant's prior ROCE against its prior performance, but the future is arguably more important. If you're interested, you can view the analysts predictions in our free report on analyst forecasts for the company.
How Are Returns Trending?
In terms of Tennant's historical ROCE movements, the trend isn't fantastic. Around five years ago the returns on capital were 20%, but since then they've fallen to 9.3%. On the other hand, the company has been employing more capital without a corresponding improvement in sales in the last year, which could suggest these investments are longer term plays. It's worth keeping an eye on the company's earnings from here on to see if these investments do end up contributing to the bottom line.
The Bottom Line
In summary, Tennant is reinvesting funds back into the business for growth but unfortunately it looks like sales haven't increased much just yet. And investors appear hesitant that the trends will pick up because the stock has fallen 19% in the last five years. In any case, the stock doesn't have these traits of a multi-bagger discussed above, so if that's what you're looking for, we think you'd have more luck elsewhere.
If you want to continue researching Tennant, you might be interested to know about the 2 warning signs that our analysis has discovered.
While Tennant isn't earning the highest return, check out this free list of companies that are earning high returns on equity with solid balance sheets.
Have feedback on this article? Concerned about the content? Get in touch with us directly. Alternatively, email editorial-team (at) simplywallst.com.
This article by Simply Wall St is general in nature. We provide commentary based on historical data and analyst forecasts only using an unbiased methodology and our articles are not intended to be financial advice. It does not constitute a recommendation to buy or sell any stock, and does not take account of your objectives, or your financial situation. We aim to bring you long-term focused analysis driven by fundamental data. Note that our analysis may not factor in the latest price-sensitive company announcements or qualitative material. Simply Wall St has no position in any stocks mentioned.
