
 Yahoo Finance
 Tennant (NYSE:TNC) investors are sitting on a loss of 22% if they invested a year ago
It's normal to be annoyed when stock you own has a declining share price. But often it is not a reflection of the fundamental business performance. The Tennant Company (NYSE:TNC) is down 23% over a year, but the total shareholder return is -22% once you include the dividend. And that total return actually beats the market decline of 23%. At least the damage isn't so bad if you look at the last three years, since the stock is down 15% in that time.
Since shareholders are down over the longer term, lets look at the underlying fundamentals over the that time and see if they've been consistent with returns.
Check out our latest analysis for Tennant
There is no denying that markets are sometimes efficient, but prices do not always reflect underlying business performance. One imperfect but simple way to consider how the market perception of a company has shifted is to compare the change in the earnings per share (EPS) with the share price movement.
Even though the Tennant share price is down over the year, its EPS actually improved. Of course, the situation might betray previous over-optimism about growth.
It's fair to say that the share price does not seem to be reflecting the EPS growth. But we might find some different metrics explain the share price movements better.
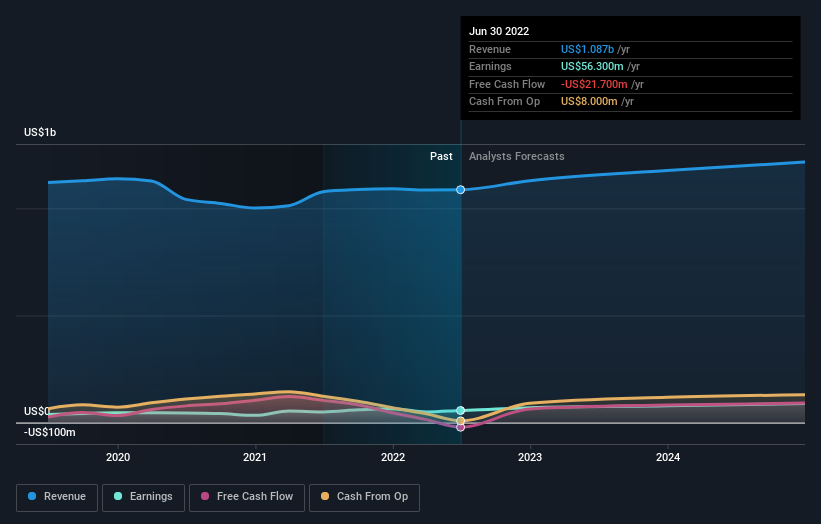
With a low yield of 1.7% we doubt that the dividend influences the share price much. Revenue was pretty flat on last year, which isn't too bad. But the share price might be lower because the market expected a meaningful improvement, and got none.
The company's revenue and earnings (over time) are depicted in the image below (click to see the exact numbers).
We know that Tennant has improved its bottom line lately, but what does the future have in store? So it makes a lot of sense to check out what analysts think Tennant will earn in the future (free profit forecasts).
A Different Perspective
Tennant shareholders are down 22% over twelve months (even including dividends), which isn't far from the market return of -23%. Unfortunately, last year's performance is a deterioration of an already poor long term track record, given the loss of 2% per year over the last five years. It will probably take a substantial improvement in the fundamental performance for the company to reverse this trend. While it is well worth considering the different impacts that market conditions can have on the share price, there are other factors that are even more important. Even so, be aware that Tennant is showing 3 warning signs in our investment analysis , and 1 of those is concerning...
We will like Tennant better if we see some big insider buys. While we wait, check out this free list of growing companies with considerable, recent, insider buying.
Please note, the market returns quoted in this article reflect the market weighted average returns of stocks that currently trade on US exchanges.
Have feedback on this article? Concerned about the content? Get in touch with us directly. Alternatively, email editorial-team (at) simplywallst.com.
This article by Simply Wall St is general in nature. We provide commentary based on historical data and analyst forecasts only using an unbiased methodology and our articles are not intended to be financial advice. It does not constitute a recommendation to buy or sell any stock, and does not take account of your objectives, or your financial situation. We aim to bring you long-term focused analysis driven by fundamental data. Note that our analysis may not factor in the latest price-sensitive company announcements or qualitative material. Simply Wall St has no position in any stocks mentioned.
Join A Paid User Research Session
You’ll receive a US$30 Amazon Gift card for 1 hour of your time while helping us build better investing tools for the individual investors like yourself. Sign up here
