
 Yahoo Finance
 Should You Be Tempted To Sell NamSys Inc. (CVE:CTZ) Because Of Its P/E Ratio?

This article is for investors who would like to improve their understanding of price to earnings ratios (P/E ratios). To keep it practical, we'll show how NamSys Inc.'s (CVE:CTZ) P/E ratio could help you assess the value on offer. NamSys has a price to earnings ratio of 17.93, based on the last twelve months. That is equivalent to an earnings yield of about 5.6%.
Check out our latest analysis for NamSys
How Do I Calculate A Price To Earnings Ratio?
The formula for P/E is:
Price to Earnings Ratio = Price per Share ÷ Earnings per Share (EPS)
Or for NamSys:
P/E of 17.93 = CA$0.87 ÷ CA$0.05 (Based on the year to July 2019.)
Is A High Price-to-Earnings Ratio Good?
A higher P/E ratio means that buyers have to pay a higher price for each CA$1 the company has earned over the last year. That isn't necessarily good or bad, but a high P/E implies relatively high expectations of what a company can achieve in the future.
Does NamSys Have A Relatively High Or Low P/E For Its Industry?
The P/E ratio indicates whether the market has higher or lower expectations of a company. You can see in the image below that the average P/E (17.9) for companies in the software industry is roughly the same as NamSys's P/E.
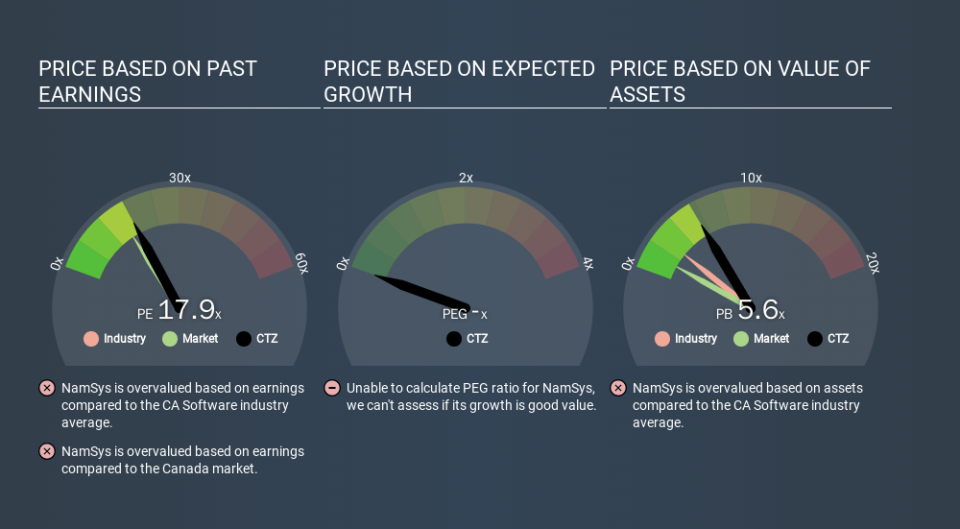
NamSys's P/E tells us that market participants think its prospects are roughly in line with its industry. The company could surprise by performing better than average, in the future. I would further inform my view by checking insider buying and selling., among other things.
How Growth Rates Impact P/E Ratios
Earnings growth rates have a big influence on P/E ratios. If earnings are growing quickly, then the 'E' in the equation will increase faster than it would otherwise. That means unless the share price increases, the P/E will reduce in a few years. So while a stock may look expensive based on past earnings, it could be cheap based on future earnings.
Most would be impressed by NamSys earnings growth of 24% in the last year. And it has bolstered its earnings per share by 44% per year over the last five years. So one might expect an above average P/E ratio.
A Limitation: P/E Ratios Ignore Debt and Cash In The Bank
The 'Price' in P/E reflects the market capitalization of the company. That means it doesn't take debt or cash into account. Hypothetically, a company could reduce its future P/E ratio by spending its cash (or taking on debt) to achieve higher earnings.
Such expenditure might be good or bad, in the long term, but the point here is that the balance sheet is not reflected by this ratio.
Is Debt Impacting NamSys's P/E?
With net cash of CA$4.3m, NamSys has a very strong balance sheet, which may be important for its business. Having said that, at 19% of its market capitalization the cash hoard would contribute towards a higher P/E ratio.
The Verdict On NamSys's P/E Ratio
NamSys trades on a P/E ratio of 17.9, which is above its market average of 15.9. Its net cash position supports a higher P/E ratio, as does its solid recent earnings growth. So it is not surprising the market is probably extrapolating recent growth well into the future, reflected in the relatively high P/E ratio.
Investors should be looking to buy stocks that the market is wrong about. As value investor Benjamin Graham famously said, 'In the short run, the market is a voting machine but in the long run, it is a weighing machine. We don't have analyst forecasts, but shareholders might want to examine this detailed historical graph of earnings, revenue and cash flow.
Of course, you might find a fantastic investment by looking at a few good candidates. So take a peek at this free list of companies with modest (or no) debt, trading on a P/E below 20.
If you spot an error that warrants correction, please contact the editor at editorial-team@simplywallst.com. This article by Simply Wall St is general in nature. It does not constitute a recommendation to buy or sell any stock, and does not take account of your objectives, or your financial situation. Simply Wall St has no position in the stocks mentioned.
We aim to bring you long-term focused research analysis driven by fundamental data. Note that our analysis may not factor in the latest price-sensitive company announcements or qualitative material. Thank you for reading.
