
 Yahoo Finance
 Should You Be Tempted To Sell AirBoss of America Corp. (TSE:BOS) Because Of Its P/E Ratio?

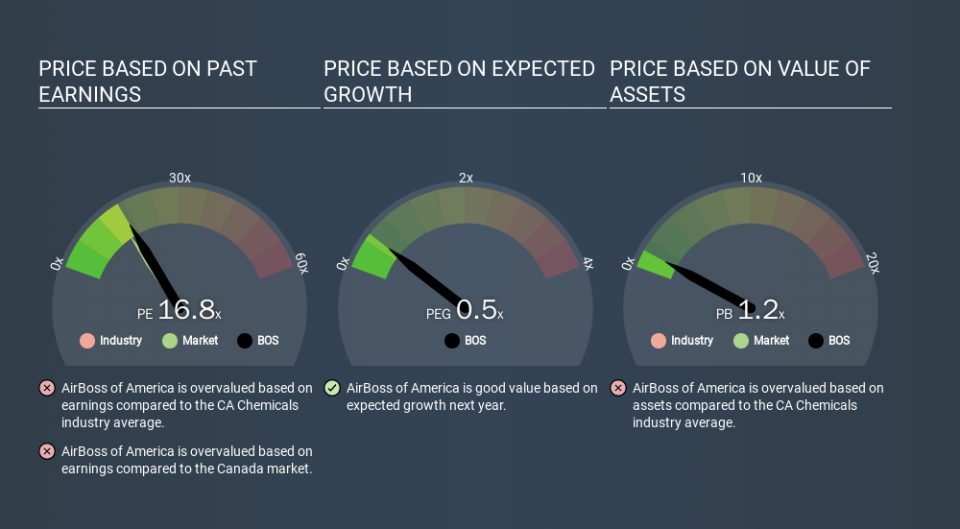
This article is for investors who would like to improve their understanding of price to earnings ratios (P/E ratios). We'll show how you can use AirBoss of America Corp.'s (TSE:BOS) P/E ratio to inform your assessment of the investment opportunity. AirBoss of America has a P/E ratio of 16.84, based on the last twelve months. That means that at current prices, buyers pay CA$16.84 for every CA$1 in trailing yearly profits.
View our latest analysis for AirBoss of America
How Do You Calculate A P/E Ratio?
The formula for P/E is:
Price to Earnings Ratio = Price per Share (in the reporting currency) ÷ Earnings per Share (EPS)
Or for AirBoss of America:
P/E of 16.84 = CA$6.54 (Note: this is the share price in the reporting currency, namely, USD ) ÷ CA$0.39 (Based on the year to September 2019.)
Is A High Price-to-Earnings Ratio Good?
The higher the P/E ratio, the higher the price tag of a business, relative to its trailing earnings. That isn't a good or a bad thing on its own, but a high P/E means that buyers have a higher opinion of the business's prospects, relative to stocks with a lower P/E.
How Does AirBoss of America's P/E Ratio Compare To Its Peers?
The P/E ratio indicates whether the market has higher or lower expectations of a company. As you can see below AirBoss of America has a P/E ratio that is fairly close for the average for the chemicals industry, which is 16.8.
AirBoss of America's P/E tells us that market participants think its prospects are roughly in line with its industry. The company could surprise by performing better than average, in the future. Further research into factors such as insider buying and selling, could help you form your own view on whether that is likely.
How Growth Rates Impact P/E Ratios
When earnings fall, the 'E' decreases, over time. Therefore, even if you pay a low multiple of earnings now, that multiple will become higher in the future. A higher P/E should indicate the stock is expensive relative to others -- and that may encourage shareholders to sell.
AirBoss of America saw earnings per share decrease by 18% last year. And over the longer term (5 years) earnings per share have decreased 1.0% annually. This might lead to muted expectations.
A Limitation: P/E Ratios Ignore Debt and Cash In The Bank
The 'Price' in P/E reflects the market capitalization of the company. Thus, the metric does not reflect cash or debt held by the company. The exact same company would hypothetically deserve a higher P/E ratio if it had a strong balance sheet, than if it had a weak one with lots of debt, because a cashed up company can spend on growth.
While growth expenditure doesn't always pay off, the point is that it is a good option to have; but one that the P/E ratio ignores.
AirBoss of America's Balance Sheet
Net debt is 35% of AirBoss of America's market cap. While that's enough to warrant consideration, it doesn't really concern us.
The Verdict On AirBoss of America's P/E Ratio
AirBoss of America's P/E is 16.8 which is above average (15.2) in its market. With a bit of debt, but a lack of recent growth, it's safe to say the market is expecting improved profit performance from the company, in the next few years.
Investors have an opportunity when market expectations about a stock are wrong. As value investor Benjamin Graham famously said, 'In the short run, the market is a voting machine but in the long run, it is a weighing machine. So this free report on the analyst consensus forecasts could help you make a master move on this stock.
Of course, you might find a fantastic investment by looking at a few good candidates. So take a peek at this free list of companies with modest (or no) debt, trading on a P/E below 20.
If you spot an error that warrants correction, please contact the editor at editorial-team@simplywallst.com. This article by Simply Wall St is general in nature. It does not constitute a recommendation to buy or sell any stock, and does not take account of your objectives, or your financial situation. Simply Wall St has no position in the stocks mentioned.
We aim to bring you long-term focused research analysis driven by fundamental data. Note that our analysis may not factor in the latest price-sensitive company announcements or qualitative material. Thank you for reading.