
 Yahoo Finance
 Should You Be Tempted To Sell Ailleron S.A. (WSE:ALL) Because Of Its P/E Ratio?

Want to participate in a short research study? Help shape the future of investing tools and you could win a $250 gift card!
The goal of this article is to teach you how to use price to earnings ratios (P/E ratios). We'll apply a basic P/E ratio analysis to Ailleron S.A.'s (WSE:ALL), to help you decide if the stock is worth further research. Based on the last twelve months, Ailleron's P/E ratio is 19.76. That corresponds to an earnings yield of approximately 5.1%.
View our latest analysis for Ailleron
How Do You Calculate A P/E Ratio?
The formula for P/E is:
Price to Earnings Ratio = Share Price ÷ Earnings per Share (EPS)
Or for Ailleron:
P/E of 19.76 = PLN8.1 ÷ PLN0.41 (Based on the year to December 2018.)
Is A High P/E Ratio Good?
The higher the P/E ratio, the higher the price tag of a business, relative to its trailing earnings. That is not a good or a bad thing per se, but a high P/E does imply buyers are optimistic about the future.
How Growth Rates Impact P/E Ratios
If earnings fall then in the future the 'E' will be lower. That means unless the share price falls, the P/E will increase in a few years. So while a stock may look cheap based on past earnings, it could be expensive based on future earnings.
Ailleron shrunk earnings per share by 45% over the last year. And it has shrunk its earnings per share by 5.7% per year over the last five years. This growth rate might warrant a below average P/E ratio.
Does Ailleron Have A Relatively High Or Low P/E For Its Industry?
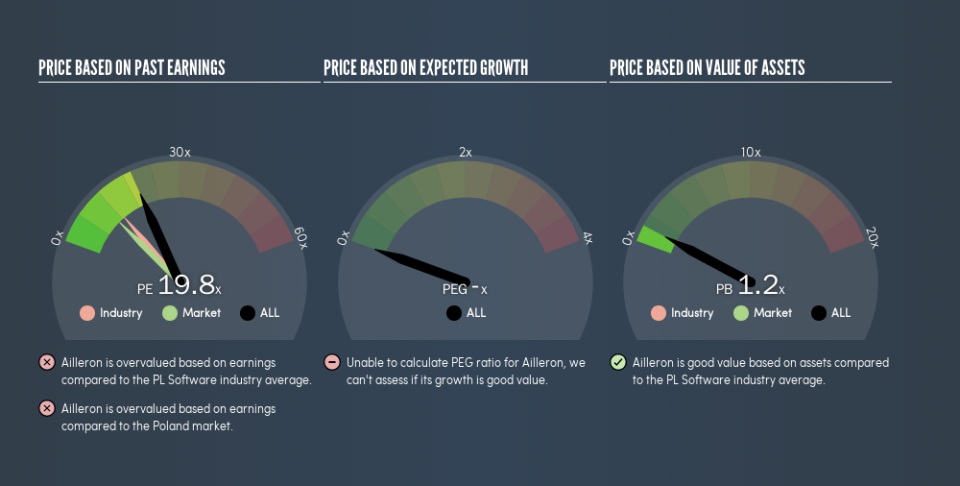
One good way to get a quick read on what market participants expect of a company is to look at its P/E ratio. The image below shows that Ailleron has a higher P/E than the average (12.7) P/E for companies in the software industry.
Its relatively high P/E ratio indicates that Ailleron shareholders think it will perform better than other companies in its industry classification. Shareholders are clearly optimistic, but the future is always uncertain. So investors should always consider the P/E ratio alongside other factors, such as whether company directors have been buying shares.
Don't Forget: The P/E Does Not Account For Debt or Bank Deposits
One drawback of using a P/E ratio is that it considers market capitalization, but not the balance sheet. In other words, it does not consider any debt or cash that the company may have on the balance sheet. In theory, a company can lower its future P/E ratio by using cash or debt to invest in growth.
While growth expenditure doesn't always pay off, the point is that it is a good option to have; but one that the P/E ratio ignores.
How Does Ailleron's Debt Impact Its P/E Ratio?
Ailleron's net debt is 3.9% of its market cap. So it doesn't have as many options as it would with net cash, but its debt would not have much of an impact on its P/E ratio.
The Bottom Line On Ailleron's P/E Ratio
Ailleron trades on a P/E ratio of 19.8, which is above the PL market average of 10.8. With modest debt but no EPS growth in the last year, it's fair to say the P/E implies some optimism about future earnings, from the market.
When the market is wrong about a stock, it gives savvy investors an opportunity. People often underestimate remarkable growth -- so investors can make money when fast growth is not fully appreciated. So this free visualization of the analyst consensus on future earnings could help you make the right decision about whether to buy, sell, or hold.
You might be able to find a better buy than Ailleron. If you want a selection of possible winners, check out this free list of interesting companies that trade on a P/E below 20 (but have proven they can grow earnings).
We aim to bring you long-term focused research analysis driven by fundamental data. Note that our analysis may not factor in the latest price-sensitive company announcements or qualitative material.
If you spot an error that warrants correction, please contact the editor at editorial-team@simplywallst.com. This article by Simply Wall St is general in nature. It does not constitute a recommendation to buy or sell any stock, and does not take account of your objectives, or your financial situation. Simply Wall St has no position in the stocks mentioned. Thank you for reading.
