
 Yahoo Finance
 Tejon Ranch Co.'s (NYSE:TRC) P/E Is On The Mark
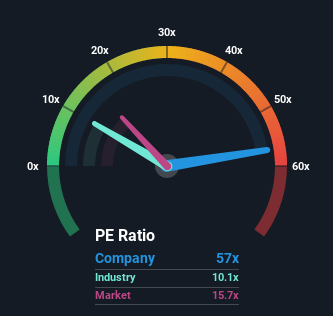
With a price-to-earnings (or "P/E") ratio of 57x Tejon Ranch Co. (NYSE:TRC) may be sending very bearish signals at the moment, given that almost half of all companies in the United States have P/E ratios under 15x and even P/E's lower than 8x are not unusual. Nonetheless, we'd need to dig a little deeper to determine if there is a rational basis for the highly elevated P/E.
With earnings growth that's exceedingly strong of late, Tejon Ranch has been doing very well. It seems that many are expecting the strong earnings performance to beat most other companies over the coming period, which has increased investors’ willingness to pay up for the stock. If not, then existing shareholders might be a little nervous about the viability of the share price.
View our latest analysis for Tejon Ranch
Want the full picture on earnings, revenue and cash flow for the company? Then our free report on Tejon Ranch will help you shine a light on its historical performance.
How Is Tejon Ranch's Growth Trending?
Tejon Ranch's P/E ratio would be typical for a company that's expected to deliver very strong growth, and importantly, perform much better than the market.
Retrospectively, the last year delivered an exceptional 252% gain to the company's bottom line. The latest three year period has also seen an excellent 53% overall rise in EPS, aided by its short-term performance. Accordingly, shareholders would have probably welcomed those medium-term rates of earnings growth.
This is in contrast to the rest of the market, which is expected to grow by 9.4% over the next year, materially lower than the company's recent medium-term annualised growth rates.
With this information, we can see why Tejon Ranch is trading at such a high P/E compared to the market. Presumably shareholders aren't keen to offload something they believe will continue to outmanoeuvre the bourse.
The Bottom Line On Tejon Ranch's P/E
Generally, our preference is to limit the use of the price-to-earnings ratio to establishing what the market thinks about the overall health of a company.
As we suspected, our examination of Tejon Ranch revealed its three-year earnings trends are contributing to its high P/E, given they look better than current market expectations. Right now shareholders are comfortable with the P/E as they are quite confident earnings aren't under threat. If recent medium-term earnings trends continue, it's hard to see the share price falling strongly in the near future under these circumstances.
Many other vital risk factors can be found on the company's balance sheet. You can assess many of the main risks through our free balance sheet analysis for Tejon Ranch with six simple checks.
Of course, you might find a fantastic investment by looking at a few good candidates. So take a peek at this free list of companies with a strong growth track record, trading on a P/E below 20x.
Have feedback on this article? Concerned about the content? Get in touch with us directly. Alternatively, email editorial-team (at) simplywallst.com.
This article by Simply Wall St is general in nature. We provide commentary based on historical data and analyst forecasts only using an unbiased methodology and our articles are not intended to be financial advice. It does not constitute a recommendation to buy or sell any stock, and does not take account of your objectives, or your financial situation. We aim to bring you long-term focused analysis driven by fundamental data. Note that our analysis may not factor in the latest price-sensitive company announcements or qualitative material. Simply Wall St has no position in any stocks mentioned.
Join A Paid User Research Session
You’ll receive a US$30 Amazon Gift card for 1 hour of your time while helping us build better investing tools for the individual investors like yourself. Sign up here
