
 Yahoo Finance
 TechnipFMC (FTI) Lags Q4 Earnings Estimates, Beats on Revenues
TechnipFMC plc FTI reported fourth-quarter 2022 net loss of 5 cents per common unit. The Zacks Consensus Estimate was of a profit of 3 cents. The underperformance was due to higher total costs and other expenses.
However, the loss was narrower than the year-ago quarter’s loss of 12 cents per share. The improvement was due to better-than-expected performances from the Subsea and Surface Technologies segments.
Adjusted EBITDA from the Subsea unit for the reported quarter totaled $140.1 million, narrowly beating the Zacks Consensus Estimate of $140 million. Surface Technologies’ profit came in at $44.4 million, outperforming the Zacks Consensus Estimate of $42.15 million.
For the quarter ended Dec 31, this subsea-to-surface oilfield equipment and services provider’s revenues of $1.7 billion marginally outperformed the Zacks Consensus Estimate of $1.6 billion. This was primarily due to a higher revenue contribution from the Subsea segment. Revenues also increased from the year-ago quarter’s $1.5 billion.
FTI’s fourth-quarter inbound orders increased 19.6% from the year-ago period’s level to $8 billion, reflecting strong revenue visibility. The company’s backlog also increased. As of Dec 31, the company’s order backlog was $9.4 billion, up about 22% from the 2021 level.
TechnipFMC plc Price, Consensus and EPS Surprise
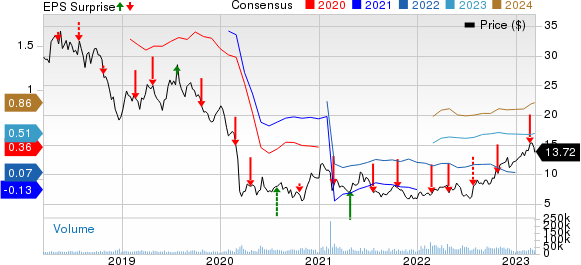
TechnipFMC plc price-consensus-eps-surprise-chart | TechnipFMC plc Quote
Segmental Analysis
Subsea: Revenues in the reported quarter were $1.3 billion, up 8.6% from the year-ago quarter’s figure of $1.2 billion. This increase was due to higher project installation activity.
Adjusted EBITDA came in at $140.1 million, up about 13.3% from the year-ago quarter’s level. This was due to improved margins in the backlog and increased installation activity. The quarterly inbound orders jumped 46.5% to $1.5 billion, while the backlog rose 24.5%.
Surface Technologies: This segment recorded revenues of $351.9 million, up 22.6 % year over year. The improvement was mainly driven by higher sales across the world, especially in the Middle East where growth exceeded 70%.
Moreover, the unit’s adjusted EBITDA increased 53.6% to $44.4 million. This was due to higher international activity, including the progressive ramp-up in the Middle East volume and the timing of associated costs.
However, the segment’s inbound orders decreased 69.5% after increasing in the previous quarter. The quarter-end backlog increased 8.6%.
Financials
In the reported quarter, TechnipFMC spent $63.6 million on capital expenditures. As of Dec 31, the company had cash and cash equivalents of $1.1 billion and long-term debt of $999.3 million, with a debt-to-capitalization of 23.6%.
2023 Outlook
TechnipFMC’s revenue expectations from the Subsea and Surface Technologies segments are in the $5.9-$6.3 billion and $1.3-$1.45 billion range, respectively, for 2023.
This London-based oilfield services provider anticipates free cash flow in the $225-375 million range for the same year.
The company’s annual capital expenditure guidance for the year is $250 million. Its net interest expense is in the $100-$110 million range.
Zacks Rank and Key Picks
Currently, TechnipFMC carries a Zacks Rank #3 (Hold). Investors interested in the energy sector might look at some better-ranked stocks like NGL Energy Partners (NGL), sporting a Zacks Rank #1 (Strong Buy), and Energy Transfer ET and Helix Energy Solutions Group HLX, both holding a Zacks Rank #2 (Buy), at present. You can see the complete list of today’s Zacks #1 Rank stocks here.
NGL Energy Partners: The company is worth approximately $451.75 million. NGL shares have increased 48.8% in the past year.
NGL Energy Partners is a limited partnership company that operates a vertically-integrated propane business with three segments — retail propane, wholesale supply and marketing, and midstream.
Energy Transfer LP: The company is valued at about $38.99 billion. ET delivered an average earnings surprise of 11.43% for the last four quarters, and its current dividend yield is 9.48%.
Energy Transfer LP currently has a forward P/E ratio of 9.17. In comparison, its industry has an average forward P/E of 9.40, which means ET is trading at a discount to the group.
Helix Energy Solutions Group: This player is valued at around $1.20 billion. In the past year, HAL stock has increased 63.3%.
Helix Energy Solutions Group currently has a forward P/E ratio of 12.02. In comparison, its industry has an average forward P/E of 12.50, which means Helix Energy Solutions Group is trading at a discount to the group.
Want the latest recommendations from Zacks Investment Research? Today, you can download 7 Best Stocks for the Next 30 Days. Click to get this free report
TechnipFMC plc (FTI) : Free Stock Analysis Report
NGL Energy Partners LP (NGL) : Free Stock Analysis Report
Energy Transfer LP (ET) : Free Stock Analysis Report
Helix Energy Solutions Group, Inc. (HLX) : Free Stock Analysis Report
