Technical Checks For US Dollar Index, Dow Jones & WTI Crude Oil: 10.08.2018
US Dollar Index [I.USDX]

Successful clearance of 95.20-40 horizontal-region seems helping the US Dollar Index to aim for the 96.75-80 and the 97.55-60 resistances; however, the 98.50 could offer intermediate halt to please greenback Bulls after 97.60 prior to challenging them with the 99.10-20 resistance-area. In case the USD gauge surpasses 99.20 barrier, the 100.00 psychological-magnet and the 101.30 may mark their presence on the chart. Should the quote fails to hold recent breakout and dips beneath the 95.20, the 94.10 and the 93.15 might act as immediate supports prior to dragging it to 92.70 and the 91.00. During the indicator’s further downside past-91.00, the 90.70-60 and the 90.00 can be considered as small stops for witnessing its plunge to 89.00 and the 88.25 levels.
Dow Jones Industrial Average [DJI30]

The DJI30’s U-turn from resistance-line of ascending trend-channel indicates brighter chances of its pullback to the 25280 and the 25200 support-levels but the 25000 round-figure and 24800 may try disappointing the Bears then after. If the equity-index dips beneath 24800 on a daily closing basis, the 200-day SMA level of 24710 and the 100-day SMA level of 24690 can gain market attention. Alternatively, the 25600, the channel-resistance mark of 25740 and the 25805-15 resistance-zone might keep restricting the gauge’s near-term advances. Assuming that the index rises beyond 25815 then the 26000, the 26150 and the 26240 can entertain the buyers.
WTI Crude Oil

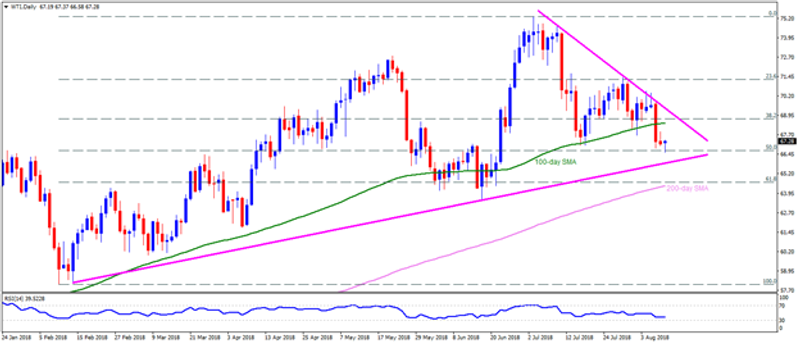
Having registered sustained trading below 100-day SMA, the WTI Crude Oil is likely to test the $65.80 trend-line support while oversold RSI could confine its downside around then. Given the sellers refrain to respect the $65.80 support-line, the 200-day SMA level of $64.40, the $64.00 and the $63.50 can be targeted if holding short positions. Meanwhile, the $68.45 figure, comprising 100-day SMA, followed by $69.50 descending trend-line, might limit the adjacent up-moves of Crude. If at all the $69.50 fails to hold the energy prices captive, then their gradual increase to the $70.00, the $70.50 and the $72.50 can’t be negated.
This article was originally posted on FX Empire

 Yahoo Finance