
 Yahoo Finance
 The Technical Chart for this Index Points to More Losses for Equities
Major global equity indices carry a strong enough correlation to warrant keeping an eye on them for potential signals for the overall markets. The UK FTSE 100 (UKX) has made a notable downside technical break that signals a bigger shift might be taking place in the markets after an already unusually large decline in the last week of February.
Technical Outlook for the FTSE 100
Specifically, the index has broken down from a rising trend channel that had encompassed price action over the last 11 years.

The monthly chart above shows the rising trend channel and the downside break as a result of this week’s price action. Further, the index shows two distinct sequences of lower highs and lower lows.
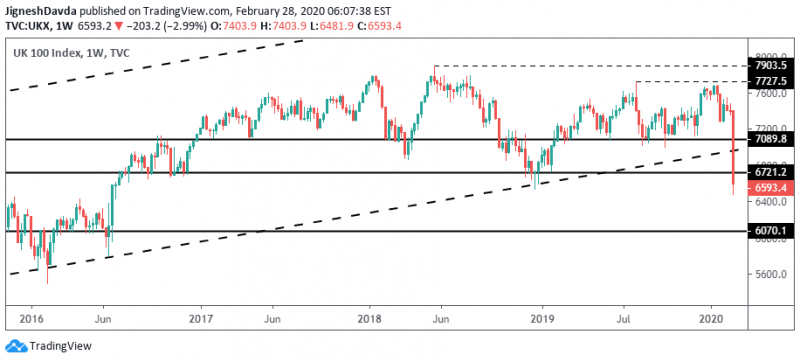
The above weekly chart shows one series of lower highs and lower lows from the peak posted in July last year. A second series, of a larger degree, can be seen from the peak printed in 2018 near the 7900 price point.
To sum up there are four things that have caught my attention from these charts. The two distinct sequences of lower highs and lower lows, the downside channel break, and lastly, the downward momentum as a result of the price action in the last week of February.
Fundamental Outlook
UK fundamentals don’t necessarily support a sharp decline in the British index. Major economic data as of late has surprised to the upside which allowed the Bank of England to remain on hold in February after having considered cutting interest rates.
At the same time, the recent escalation in Coronavirus fears might shift the central bank back towards the prospect of monetary policy easing which generally would be supportive for equities.
But the Coronavirus itself presents a tremendous amount of uncertainty, especially after it became apparent in the past week that China is not doing well to contain it.
Members of the European Central Bank and the Federal Reserve this week did not appear to see the urgency in the virus threat this week in the same manner that the markets have. Comments from officials followed mostly the same rhetoric, that it was too soon to assess if a monetary policy adjustment will be required. Meanwhile, the Fed Funds futures show that the markets have fully priced in a US rate cut in March and are starting to price in a potentially larger 50 basis point cut.
Bank of England Governor Mark Carney took a more cautious approach in an interview with Sky News and acknowledged that the virus has led to a decline in tourism and is impacting businesses that rely on supply chains originating from China. However, he did not discuss whether UK policymakers were considering monetary policy easing.
Correlations in the Global Markets
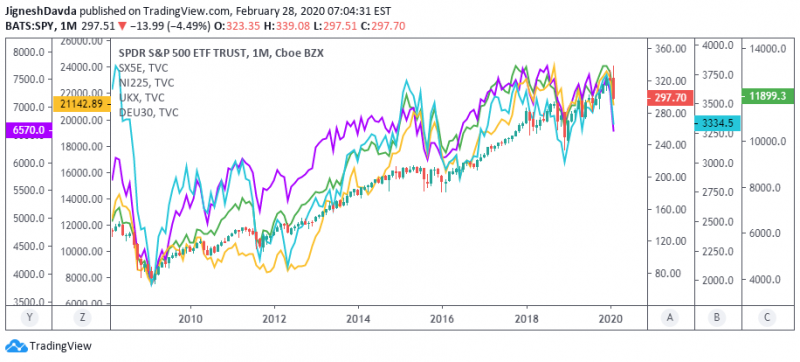
The above charts show that the major indices – FTSE 100, Euro Stoxx 50, Dax 30, Nikkei 225, and the S&P 500 have a fairly strong correlation with each other. It can be argued the US index is much stronger compared to the others and the correlation is not as strong.
It is very much possible that a divergence takes place, considering that the UK is about to begin trade negotiations with the EU, although this is not something I would personally count on.
As a result of these correlations, my view is that the bearish signal in the FTSE 100 is pointing to more downside to come for the global equity markets.
Bottom Line
While it could be entirely possible that the UK index is forming a bear trap, I’m taking a much more cautious approach when it comes to equities. I think it is a dangerous time to try and catch the falling knife in stocks, even though it may have worked for some in the past. Rather, I think it’s best to sit on the sidelines and let things develop and revisit getting long equities once there is more clarity surrounding the virus and its potential impacts.
This article was originally posted on FX Empire
More From FXEMPIRE:
Oil Price Fundamental Daily Forecast – Prices May Be Too Cheap for Buyers to Ignore
AUD/USD Weekly Price Forecast – Australian Dollar Gets Crushed for The Week
GBP/JPY Weekly Price Forecast – British Pound Continues to Get Hammered Against Japanese Yen
Global Shares Routed as Investors Ditch Risky Assets on Fear of Worldwide Recession
