
 Yahoo Finance
 TE Connectivity (TEL) Q4 Earnings Beat, Revenues Down Y/Y
TE Connectivity Ltd. TEL reported fourth-quarter fiscal 2019 adjusted earnings of $1.33 per share, beating the Zacks Consensus Estimate by 2 cents. Notably, the figure met the higher end of management’s guidance.
However, the bottom line declined 1.5% on a year-over-year basis.
Net sales in the reported quarter were $3.3 billion, which surpassed the Zacks Consensus Estimate of $3.27 billion. Further, the figure matched the higher end of the guided range. However, the figure declined 6% from the year-ago quarter.
This can be attributed to weakness in the key end-markets. Further, weak performance by Transportation and Communication segments of the company impacted the top line. Moreover, declining orders remains an overhang.
The company’s total orders came in at $3.2 billion during the reported quarter.
Nevertheless, continued solid execution of the company’s strategic plans especially cost reduction initiatives in order to generate strong cash flow, is likely to aid it in winning shareholders’ confidence. Further, the company is expanding content in engineered solutions.
Top-Line in Detail
TE Connectivity operates in three organized segments.
Transportation Solutions: The company generated $1.89 billion of sales (57.5% of net sales) in the reported quarter, down 5.8% on a year-over-year basis. This can be attributed to weakness in auto production globally, which resulted in a year-over-year decline of 6% in automotive sales. Further, its commercial transportation business was down 9% from the year-ago quarter. However, the company witnessed improved performance by its sensor business, which was up 1% year over year.
Industrial Solutions: This segment yielded sales of $1.01 billion (30.7% of net sales), which remained flat year over year. The company witnessed 7% decline in its industrial equipment business on a year-over-year basis. Further, growth in energy solutions in North America and China was offset by softness in Europe. Energy was down 2% from the year-ago quarter.
However, TE Connectivity experienced solid momentum in aerospace, defense and marine field where it witnessed 12% growth year over year. Further, it gained traction across medical applications during the reported quarter.
Communications Solutions: This segment generated sales of $390 million (11.8% of net sales), decreasing 19% year over year. This can be attributed to inventory destocking, which resulted in a decline of 18% in data & devices and 21% in appliances solutions on a year-over-year basis.
TE Connectivity Ltd. Price, Consensus and EPS Surprise
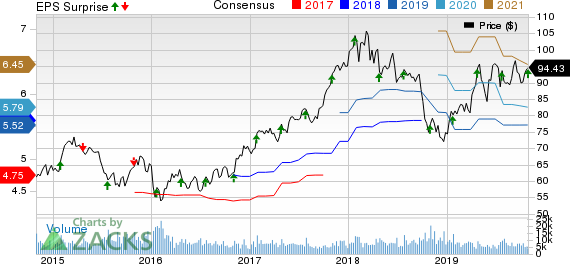
TE Connectivity Ltd. price-consensus-eps-surprise-chart | TE Connectivity Ltd. Quote
Operating Details
Per the company, gross margin came in 31.9%, contracting 180 bps from the year-ago quarter.
We note that R&D expenses were $159 million, down 7% from the prior-year quarter. Further, selling, general, and administrative expenses came in at $372 million, down 10.1% year over year.
However, acquisition and integration expenses totaled $6 million, up 20% from the year-ago quarter. Further, restructuring costs increased significantly from $22 million in the year-ago quarter to $71 million in the reported quarter.
Consequently, adjusted operating margin came in at 16.3%, contracting 70 bps from the prior-year quarter.
Balance Sheet & Cash Flow
As of Sep 27, 2019, TE Connectivity’s cash and cash equivalents of $927 million, higer than $546 million as of Jun 28, 2019.
Long-term debt was $3.39 billon, down from $3.43 billion in the previous quarter.
The company generated $878 million of cash from operation in the fiscal fourth quarter, compared with $691 million in the fiscal third quarter.
Further, free cash flow of $688 million was generated in the reported quarter. Additionally, TE Connectivity paid out $332 million to shareholders through share repurchases and dividend payments.
Guidance
For fiscal first-quarter 2020, the company expects net sales in the range of $3 billion to $3.2 billion. The Zacks Consensus Estimate for sales is pegged at $3.25 billion.
Adjusted earnings per share are projected in the band of $1.10-$1.16 for the first quarter. The Zacks Consensus Estimate for earnings is pegged at $1.32 per share.
For fiscal 2020, TE Connectivity anticipates net sales between $12.7 billion and $13.3 billion. The Zacks Consensus Estimate for earnings for 2020 is pegged at $13.59 billion.
Further, adjusted earnings for fiscal 2020 are expected between $4.85 and $5.25 per share. The Zacks Consensus Estimate for earnings is pegged at $5.79 per share.
TE Connectivity is likely to continue facing weakness and uncertainties in market conditions worldwide in 2020.
Zacks Rank & Key Picks
TE Connectivity currently has a Zacks Rank #4 (Sell).
Some better-ranked stocks in the broader technology sector are NetEase, Inc. NTES, Itron, Inc. ITRI and Five9, Inc. FIVN. All the stocks sport a Zacks Rank #1 (Strong Buy). You can see the complete list of today’s Zacks #1 Rank stocks here.
Long-term earnings growth rate for NetEase, Itron and Five9 is currently pegged at 31.93%, 25 and 10%, respectively.
Today's Best Stocks from Zacks
Would you like to see the updated picks from our best market-beating strategies? From 2017 through 2018, while the S&P 500 gained +15.8%, five of our screens returned +38.0%, +61.3%, +61.6%, +68.1%, and +98.3%.
This outperformance has not just been a recent phenomenon. From 2000 – 2018, while the S&P averaged +4.8% per year, our top strategies averaged up to +56.2% per year.
See their latest picks free >>
Want the latest recommendations from Zacks Investment Research? Today, you can download 7 Best Stocks for the Next 30 Days. Click to get this free report
NetEase, Inc. (NTES) : Free Stock Analysis Report
Five9, Inc. (FIVN) : Free Stock Analysis Report
TE Connectivity Ltd. (TEL) : Free Stock Analysis Report
Itron, Inc. (ITRI) : Free Stock Analysis Report
To read this article on Zacks.com click here.
Zacks Investment Research
