
 Yahoo Finance
 Synovus (SNV) Q1 Earnings Beat Estimates, Provisions Rise
Synovus Financial Corp. SNV reported first-quarter 2023 adjusted earnings per share of $1.33, which surpassed the Zacks Consensus Estimate of $1.22. The bottom line improved from 23% in the prior-year quarter.
An increase in interest rates and decent loan growth supported net interest income (NII) and the net interest margin (NIM), while fee income increased. Results were adversely impacted by the rise in provisions on deteriorating economic expectations and higher expenses.
Net income available to common shareholders was $193.8 million, up 19% from the prior-year quarter.
Revenues & Expenses Rise
Total revenues in the first quarter were $613.8 million, up 23% from the prior-year quarter. The top line beat the Zacks Consensus Estimate of $585.9 million.
NII improved 23% year over year to $480.7 million. The rise was driven by loan growth and interest rate increases, offset by higher deposit pricing. NIM rose 42 basis points (bps) to 3.43%.
Non-interest revenues increased 26% to $133.1 million. The main reasons behind the increase were higher capital market income and card fee income.
Non-interest expenses were $321.8 million, up 18% year over year. The rise mainly resulted from an increase in salaries and other personnel expenses, and FDIC insurance and other regulatory fees.
The adjusted tangible efficiency ratio was 50.48% compared with 55.50% in the year-earlier quarter. A decrease in this ratio indicates a rise in profitability.
Total loans of $44.04 billion showed a 1% improvement sequentially. Total deposits were $49.85 billion, up 2% from the previous quarter.
Credit Quality: Mixed Bag
Non-performing loans increased 38% year over year to $182.4 million. Total non-performing assets amounted to $182.4 million, up 15%. Provision for credit losses was $32.1 million, up 182% from the prior-year quarter.
Net charge-offs declined marginally to $18.5 million. Non-performing asset ratio was at 0.41%, down 1 bp from the prior-year quarter. The net charge-offs ratio was 0.17% compared with the previous-year quarter’s 0.19%.
Capital & Profitability Ratios Solid
As of Mar 31, 2023, the Tier 1 capital ratio and total risk-based capital ratio were 10.79% and 12.69%, respectively, compared with 10.63% and 12.56% in the year-ago quarter. Moreover, as of the same date, the Common Equity Tier 1 capital ratio was 9.76%, up from 9.49% in the year-ago quarter.
The Tier 1 leverage ratio was 9.14%, improving from 8.87% in the year-earlier period.
Return on average assets was 1.36%, up from the prior-year quarter’s 1.22%. Return on average common equity was 19.23%, up from 14.20%.
Our Take
With the high rates, the company’s NII and margins are likely to continue increasing in the upcoming period. However, the rising provision for credit losses on account of the worsening macroeconomic outlook is concerning. Also, rising operating expenses can impede bottom-line growth in the near term.
Synovus Financial Corp. Price, Consensus and EPS Surprise
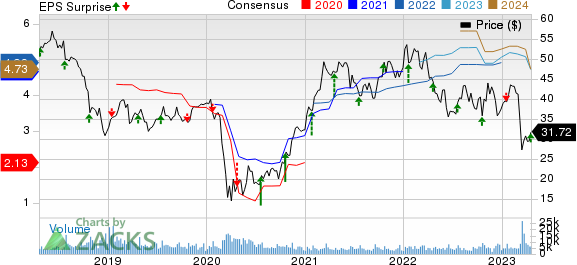
Synovus Financial Corp. price-consensus-eps-surprise-chart | Synovus Financial Corp. Quote
Currently, Synovus carries a Zacks Rank #4 (Sell).
You can see the complete list of today’s Zacks #1 Rank (Strong Buy) stocks here.
Performance of Other Banks
U.S. Bancorp’s USB first-quarter 2023 earnings per share (excluding merger and integration-related charges) of $1.16 handily beat the Zacks Consensus Estimate of $1.13 per share. It grew 17.2% from the prior-year quarter.
USB’s results benefited from an increase in NII, supported by higher interest rates. However, a decline in non-interest income (largely on lower mortgage banking income) and higher expenses were the headwinds. Also, USB’s credit quality deteriorated in the reported quarter.
Citizens Financial Group CFG reported first-quarter 2023 earnings per share of $1, missing the Zacks Consensus Estimate of $1.11. Nonetheless, the bottom line rose from 93 cents in the year-ago quarter.
CFG’s results reflect NII growth on an increase in interest-earning assets. However, an escalation in expenses, lower non-interest income and a rise in provisions were the undermining factors for CFG.
Want the latest recommendations from Zacks Investment Research? Today, you can download 7 Best Stocks for the Next 30 Days. Click to get this free report
Synovus Financial Corp. (SNV) : Free Stock Analysis Report
U.S. Bancorp (USB) : Free Stock Analysis Report
Citizens Financial Group, Inc. (CFG) : Free Stock Analysis Report
