
 Yahoo Finance
 Swelling losses haven't held back gains for Electrovaya (TSE:EFL) shareholders since they're up 210% over 3 years
The Electrovaya Inc. (TSE:EFL) share price is down a rather concerning 37% in the last month. But that doesn't undermine the rather lovely longer-term return, if you measure over the last three years. The share price marched upwards over that time, and is now 210% higher than it was. After a run like that some may not be surprised to see prices moderate. The fundamental business performance will ultimately dictate whether the top is in, or if this is a stellar buying opportunity.
While this past week has detracted from the company's three-year return, let's look at the recent trends of the underlying business and see if the gains have been in alignment.
See our latest analysis for Electrovaya
Electrovaya isn't currently profitable, so most analysts would look to revenue growth to get an idea of how fast the underlying business is growing. When a company doesn't make profits, we'd generally expect to see good revenue growth. As you can imagine, fast revenue growth, when maintained, often leads to fast profit growth.
Electrovaya's revenue trended up 35% each year over three years. That's well above most pre-profit companies. Meanwhile, the share price performance has been pretty solid at 46% compound over three years. But it does seem like the market is paying attention to strong revenue growth. That's not to say we think the share price is too high. In fact, it might be worth keeping an eye on this one.
The company's revenue and earnings (over time) are depicted in the image below (click to see the exact numbers).
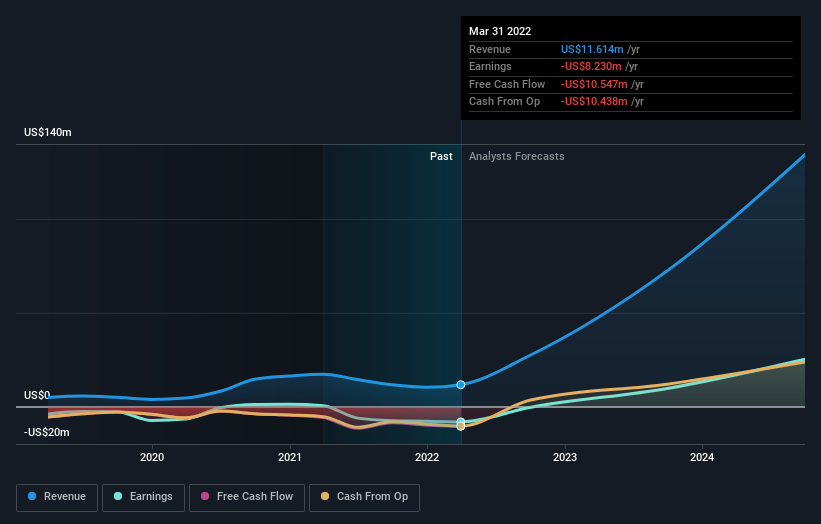
This free interactive report on Electrovaya's balance sheet strength is a great place to start, if you want to investigate the stock further.
A Different Perspective
Electrovaya shareholders are down 57% for the year, but the market itself is up 2.5%. However, keep in mind that even the best stocks will sometimes underperform the market over a twelve month period. Unfortunately, last year's performance may indicate unresolved challenges, given that it was worse than the annualised loss of 11% over the last half decade. Generally speaking long term share price weakness can be a bad sign, though contrarian investors might want to research the stock in hope of a turnaround. I find it very interesting to look at share price over the long term as a proxy for business performance. But to truly gain insight, we need to consider other information, too. Consider for instance, the ever-present spectre of investment risk. We've identified 5 warning signs with Electrovaya (at least 2 which shouldn't be ignored) , and understanding them should be part of your investment process.
Of course, you might find a fantastic investment by looking elsewhere. So take a peek at this free list of companies we expect will grow earnings.
Please note, the market returns quoted in this article reflect the market weighted average returns of stocks that currently trade on CA exchanges.
Have feedback on this article? Concerned about the content? Get in touch with us directly. Alternatively, email editorial-team (at) simplywallst.com.
This article by Simply Wall St is general in nature. We provide commentary based on historical data and analyst forecasts only using an unbiased methodology and our articles are not intended to be financial advice. It does not constitute a recommendation to buy or sell any stock, and does not take account of your objectives, or your financial situation. We aim to bring you long-term focused analysis driven by fundamental data. Note that our analysis may not factor in the latest price-sensitive company announcements or qualitative material. Simply Wall St has no position in any stocks mentioned.
