
 Yahoo Finance
 Are Superior Gold Inc’s (CVE:SGI) Interest Costs Too High?

Investors are always looking for growth in small-cap stocks like Superior Gold Inc (CVE:SGI), with a market cap of CA$77m. However, an important fact which most ignore is: how financially healthy is the business? Since SGI is loss-making right now, it’s crucial to understand the current state of its operations and pathway to profitability. I believe these basic checks tell most of the story you need to know. Though, I know these factors are very high-level, so I recommend you dig deeper yourself into SGI here.
How much cash does SGI generate through its operations?
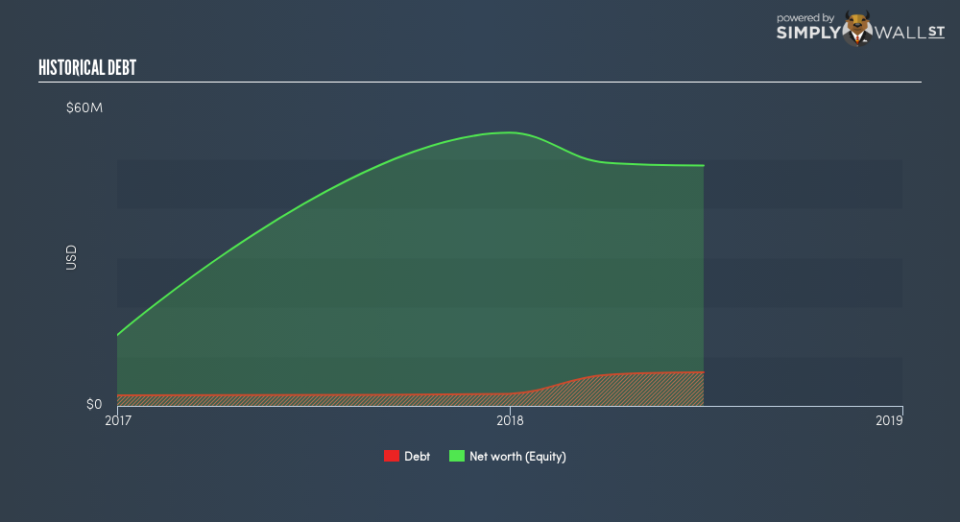
SGI’s debt levels surged from US$2m to US$7m over the last 12 months , which is mainly comprised of near term debt. With this growth in debt, SGI’s cash and short-term investments stands at US$22m , ready to deploy into the business. Moreover, SGI has generated US$15m in operating cash flow in the last twelve months, resulting in an operating cash to total debt ratio of 217%, indicating that SGI’s current level of operating cash is high enough to cover debt. This ratio can also be interpreted as a measure of efficiency for unprofitable companies as traditional metrics such as return on asset (ROA) requires positive earnings. In SGI’s case, it is able to generate 2.17x cash from its debt capital.
Does SGI’s liquid assets cover its short-term commitments?
Looking at SGI’s most recent US$19m liabilities, it appears that the company has been able to meet these obligations given the level of current assets of US$40m, with a current ratio of 2.06x. Usually, for Metals and Mining companies, this is a suitable ratio as there’s enough of a cash buffer without holding too much capital in low return investments.
Can SGI service its debt comfortably?
With debt at 14% of equity, SGI may be thought of as appropriately levered. SGI is not taking on too much debt commitment, which may be constraining for future growth. SGI’s risk around capital structure is low, and the company has the headroom and ability to raise debt should it need to in the future.
Next Steps:
SGI has demonstrated its ability to generate sufficient levels of cash flow, while its debt hovers at a safe level. Furthermore, the company exhibits proper management of current assets and upcoming liabilities. This is only a rough assessment of financial health, and I’m sure SGI has company-specific issues impacting its capital structure decisions. I suggest you continue to research Superior Gold to get a more holistic view of the stock by looking at:
Future Outlook: What are well-informed industry analysts predicting for SGI’s future growth? Take a look at our free research report of analyst consensus for SGI’s outlook.
Valuation: What is SGI worth today? Is the stock undervalued, even when its growth outlook is factored into its intrinsic value? The intrinsic value infographic in our free research report helps visualize whether SGI is currently mispriced by the market.
Other High-Performing Stocks: Are there other stocks that provide better prospects with proven track records? Explore our free list of these great stocks here.
To help readers see past the short term volatility of the financial market, we aim to bring you a long-term focused research analysis purely driven by fundamental data. Note that our analysis does not factor in the latest price-sensitive company announcements.
The author is an independent contributor and at the time of publication had no position in the stocks mentioned. For errors that warrant correction please contact the editor at editorial-team@simplywallst.com.
