
 Yahoo Finance
 Suncor (Su) Q3 Earnings Beat on Higher Production & Prices

Suncor Energy SU reported third-quarter 2018 operating earnings per share of 73 cents, topping the Zacks Consensus Estimate of 71 cents. The better-than-expected results can be attributed to improved commodity price realizations, higher refining margins, along with robust production volumes from Hebron and Fort Hills. The bottom line also improved from the prior-year earnings of 41 cents per share.
Quarterly operating revenues of the Canadian integrated giant came in at $8,312 million, lagging the Zacks Consensus Estimate of $9,289 million. However, the top line increased from $6,403 million in the year-ago quarter.
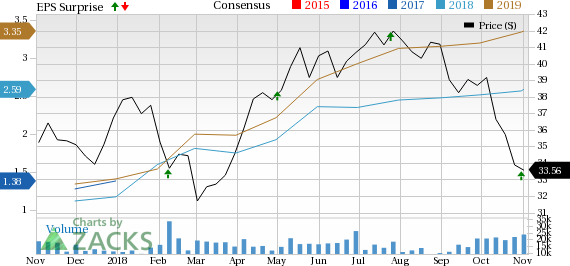
Suncor Energy Inc. Price, Consensus and EPS Surprise
Suncor Energy Inc. Price, Consensus and EPS Surprise | Suncor Energy Inc. Quote
Upstream
Total upstream production in the reported quarter was 743,800 barrels of oil equivalent per day (Boe/d), up from the prior-year level of 739,900 Boe/d. Net earnings from the upstream unit totaled C$1,013 million, up a whopping 113% year-over-year.
Oil Sands operations volume was 476,100 barrels per day (Bbl/d) compared with 469,300 Bbl/d in the year-ago quarter, setting a new production record for the company. The increase can be attributed to robust volumes from In Situ production. Notably, upgrader utilization came in at 95% compared with 93% in the year-ago quarter. However, operating costs per barrel increased to $22 in the quarter under review from $21.60 in the corresponding quarter of 2017.
Notably, Fort Hills production came in at 69,400 Bbl/d in the quarter under review.
Production from Syncrude operations decreased to 106,200 Bbl/d from 159,100 Bbl/d in the year-ago quarter amid power outage. In the quarter under review, upgrader reliability at Syncrude was 52%, lower than 84% in the year-ago quarter.
Suncor’s Exploration and Production segment (consisting of International, as well as Offshore and Natural Gas segments) produced 92,100 Boe/d compared with 111,500 Boe/d in the prior-year quarter. The results were impacted by planned maintenance at Buzzard and Hibernia, along with a decline in North Sea production levels, partially offset by increased output from Hebron.
Downstream
Net earnings from the upstream unit totaled C$939 million, compared with the year-ago figure of C$597 million. The company’s refined product sales of 565,500 Bbl/d increased from the prior-year level of 564,500 Bbl/d. Refining margin was C$34.45 a barrel vis-a vis C$24.25 in the year-ago quarter. Also, refinery utilization came in at 99% compared with 101% in the year-ago quarter. Meanwhile, Crude throughput came in at 457,200 Bbl/d in the third quarter compared with 466,800 Bbl/d in the year-ago quarter.
Expenses
Total expenses in the reported quarter increased to C$8,398 million from C$6,329 million in the year-ago quarter. The increase in total expenses is mainly attributed to higher costs related to the purchase of oil along with a rise in operating expenses.
Balance Sheet & Capital Expenditures
As of Sep 30, 2018, the Canadian energy giant had cash and cash equivalents of C$2,332 million, and total long-term debt of C$13,354 million. The total debt-to-capitalization ratio was approximately 22.6%. The company incurred capital expenditure of C$1,180 million in the quarter under review.
Dividend and Share Repurchase
Cash flow from operating activities came in at C$4,370 million in the third quarter, up 50% from the prior-year figure.
Suncor returned C$582 million to its shareholders through dividends and bought back C$889 million of outstanding shares in third-quarter 2018. On a further encouraging note, Suncor increased its share buyback budget from C$2.15 billion to C$3 billion, as a show of its confidence in cash inflows.
2018 Guidance
Suncor reiterated its output guidance for the full year of 2018, anticipating production within 740,000-750,000 Boe/d. Production from oilsands is estimated within 415,000-430,000 bbls/d. Production estimates from Syncrude are expected in the band of 140,000-145,000 bbls/d. Fort Hills’ output is expected within 60,000-70,000 bbls/d. For 2018, capex is expected in the band of C$5.2-C$5.5 billion, unchanged from the prior guidance.
Considering the business environment outlook, the income tax expense range has been reduced to C$1.6-C$1.8 billion from the prior guidance of $1.7-$2.0 million.
Zacks Rank & Other Stocks to Consider
Currently, Suncor carries a Zacks Rank #2 (Buy).
Some other top-ranked players in the energy space are Parsley Energy PE, Enbridge Inc. ENB and Bonanza Creek Energy Inc. BCEI, each sporting a Zacks Rank #1 (Strong Buy). You can see the complete list of today’s Zacks #1 Rank stocks here.
Parsley Energy pulled off an average positive earnings surprise of 26.24% in the trailing four reported quarters.
Enbridge came up with an average positive earnings surprise of 33.19% in the preceding four reported quarters.
Bonanza Creek delivered an average positive earnings surprise of 74.88% in the last four reported quarters.
Looking for Stocks with Skyrocketing Upside?
Zacks has just released a Special Report on the booming investment opportunities of legal marijuana.
Ignited by new referendums and legislation, this industry is expected to blast from an already robust $6.7 billion to $20.2 billion in 2021. Early investors stand to make a killing, but you have to be ready to act and know just where to look.
See the pot trades we're targeting>>
Want the latest recommendations from Zacks Investment Research? Today, you can download 7 Best Stocks for the Next 30 Days. Click to get this free report
Suncor Energy Inc. (SU) : Free Stock Analysis Report
Enbridge Inc (ENB) : Free Stock Analysis Report
Bonanza Creek Energy, Inc. (BCEI) : Free Stock Analysis Report
Parsley Energy, Inc. (PE) : Free Stock Analysis Report
To read this article on Zacks.com click here.
