
 Yahoo Finance
 Staffline Group (LON:STAF) Is Finding It Tricky To Allocate Its Capital
When researching a stock for investment, what can tell us that the company is in decline? When we see a declining return on capital employed (ROCE) in conjunction with a declining base of capital employed, that's often how a mature business shows signs of aging. This indicates to us that the business is not only shrinking the size of its net assets, but its returns are falling as well. Having said that, after a brief look, Staffline Group (LON:STAF) we aren't filled with optimism, but let's investigate further.
What is Return On Capital Employed (ROCE)?
For those that aren't sure what ROCE is, it measures the amount of pre-tax profits a company can generate from the capital employed in its business. The formula for this calculation on Staffline Group is:
Return on Capital Employed = Earnings Before Interest and Tax (EBIT) ÷ (Total Assets - Current Liabilities)
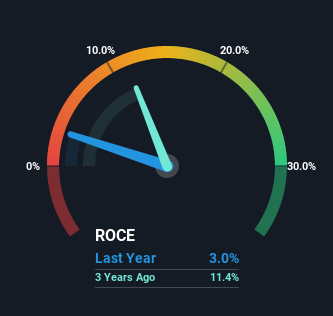
0.03 = UK£2.3m ÷ (UK£236m - UK£160m) (Based on the trailing twelve months to December 2021).
Therefore, Staffline Group has an ROCE of 3.0%. Ultimately, that's a low return and it under-performs the Professional Services industry average of 13%.
See our latest analysis for Staffline Group
In the above chart we have measured Staffline Group's prior ROCE against its prior performance, but the future is arguably more important. If you'd like, you can check out the forecasts from the analysts covering Staffline Group here for free.
How Are Returns Trending?
The trend of returns that Staffline Group is generating are raising some concerns. Unfortunately, returns have declined substantially over the last five years to the 3.0% we see today. In addition to that, Staffline Group is now employing 46% less capital than it was five years ago. When you see both ROCE and capital employed diminishing, it can often be a sign of a mature and shrinking business that might be in structural decline. If these underlying trends continue, we wouldn't be too optimistic going forward.
While on the subject, we noticed that the ratio of current liabilities to total assets has risen to 68%, which has impacted the ROCE. Without this increase, it's likely that ROCE would be even lower than 3.0%. And with current liabilities at these levels, suppliers or short-term creditors are effectively funding a large part of the business, which can introduce some risks.
The Bottom Line
In short, lower returns and decreasing amounts capital employed in the business doesn't fill us with confidence. This could explain why the stock has sunk a total of 96% in the last five years. That being the case, unless the underlying trends revert to a more positive trajectory, we'd consider looking elsewhere.
If you want to know some of the risks facing Staffline Group we've found 3 warning signs (1 can't be ignored!) that you should be aware of before investing here.
While Staffline Group may not currently earn the highest returns, we've compiled a list of companies that currently earn more than 25% return on equity. Check out this free list here.
Have feedback on this article? Concerned about the content? Get in touch with us directly. Alternatively, email editorial-team (at) simplywallst.com.
This article by Simply Wall St is general in nature. We provide commentary based on historical data and analyst forecasts only using an unbiased methodology and our articles are not intended to be financial advice. It does not constitute a recommendation to buy or sell any stock, and does not take account of your objectives, or your financial situation. We aim to bring you long-term focused analysis driven by fundamental data. Note that our analysis may not factor in the latest price-sensitive company announcements or qualitative material. Simply Wall St has no position in any stocks mentioned.
