
 Yahoo Finance
 Staffline Group (LON:STAF) Could Be Struggling To Allocate Capital
What underlying fundamental trends can indicate that a company might be in decline? Typically, we'll see the trend of both return on capital employed (ROCE) declining and this usually coincides with a decreasing amount of capital employed. Basically the company is earning less on its investments and it is also reducing its total assets. So after we looked into Staffline Group (LON:STAF), the trends above didn't look too great.
What Is Return On Capital Employed (ROCE)?
For those that aren't sure what ROCE is, it measures the amount of pre-tax profits a company can generate from the capital employed in its business. The formula for this calculation on Staffline Group is:
Return on Capital Employed = Earnings Before Interest and Tax (EBIT) ÷ (Total Assets - Current Liabilities)
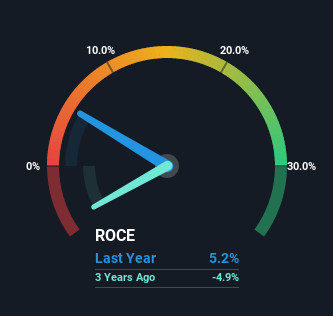
0.052 = UK£4.0m ÷ (UK£236m - UK£159m) (Based on the trailing twelve months to December 2022).
Thus, Staffline Group has an ROCE of 5.2%. In absolute terms, that's a low return and it also under-performs the Professional Services industry average of 16%.
See our latest analysis for Staffline Group
In the above chart we have measured Staffline Group's prior ROCE against its prior performance, but the future is arguably more important. If you're interested, you can view the analysts predictions in our free report on analyst forecasts for the company.
So How Is Staffline Group's ROCE Trending?
In terms of Staffline Group's historical ROCE trend, it isn't fantastic. Unfortunately, returns have declined substantially over the last five years to the 5.2% we see today. On top of that, the business is utilizing 46% less capital within its operations. The fact that both are shrinking is an indication that the business is going through some tough times. Typically businesses that exhibit these characteristics aren't the ones that tend to multiply over the long term, because statistically speaking, they've already gone through the growth phase of their life cycle.
On a side note, Staffline Group's current liabilities have increased over the last five years to 67% of total assets, effectively distorting the ROCE to some degree. If current liabilities hadn't increased as much as they did, the ROCE could actually be even lower. What this means is that in reality, a rather large portion of the business is being funded by the likes of the company's suppliers or short-term creditors, which can bring some risks of its own.
The Key Takeaway
In summary, it's unfortunate that Staffline Group is shrinking its capital base and also generating lower returns. Unsurprisingly then, the stock has dived 96% over the last five years, so investors are recognizing these changes and don't like the company's prospects. With underlying trends that aren't great in these areas, we'd consider looking elsewhere.
Like most companies, Staffline Group does come with some risks, and we've found 2 warning signs that you should be aware of.
For those who like to invest in solid companies, check out this free list of companies with solid balance sheets and high returns on equity.
Have feedback on this article? Concerned about the content? Get in touch with us directly. Alternatively, email editorial-team (at) simplywallst.com.
This article by Simply Wall St is general in nature. We provide commentary based on historical data and analyst forecasts only using an unbiased methodology and our articles are not intended to be financial advice. It does not constitute a recommendation to buy or sell any stock, and does not take account of your objectives, or your financial situation. We aim to bring you long-term focused analysis driven by fundamental data. Note that our analysis may not factor in the latest price-sensitive company announcements or qualitative material. Simply Wall St has no position in any stocks mentioned.
Join A Paid User Research Session
You’ll receive a US$30 Amazon Gift card for 1 hour of your time while helping us build better investing tools for the individual investors like yourself. Sign up here