
 Yahoo Finance
 Sportradar Group (NASDAQ:SRAD) Could Be Struggling To Allocate Capital
What are the early trends we should look for to identify a stock that could multiply in value over the long term? Firstly, we'll want to see a proven return on capital employed (ROCE) that is increasing, and secondly, an expanding base of capital employed. Ultimately, this demonstrates that it's a business that is reinvesting profits at increasing rates of return. Having said that, from a first glance at Sportradar Group (NASDAQ:SRAD) we aren't jumping out of our chairs at how returns are trending, but let's have a deeper look.
Understanding Return On Capital Employed (ROCE)
If you haven't worked with ROCE before, it measures the 'return' (pre-tax profit) a company generates from capital employed in its business. The formula for this calculation on Sportradar Group is:
Return on Capital Employed = Earnings Before Interest and Tax (EBIT) ÷ (Total Assets - Current Liabilities)
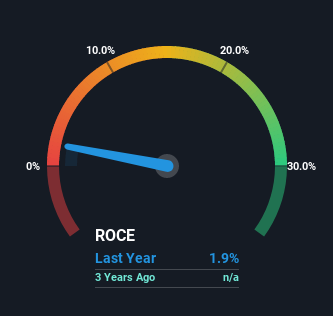
0.019 = €29m ÷ (€1.8b - €284m) (Based on the trailing twelve months to June 2022).
Therefore, Sportradar Group has an ROCE of 1.9%. In absolute terms, that's a low return and it also under-performs the Hospitality industry average of 9.6%.
View our latest analysis for Sportradar Group
Above you can see how the current ROCE for Sportradar Group compares to its prior returns on capital, but there's only so much you can tell from the past. If you'd like to see what analysts are forecasting going forward, you should check out our free report for Sportradar Group.
What Does the ROCE Trend For Sportradar Group Tell Us?
We weren't thrilled with the trend because Sportradar Group's ROCE has reduced by 74% over the last two years, while the business employed 145% more capital. Usually this isn't ideal, but given Sportradar Group conducted a capital raising before their most recent earnings announcement, that would've likely contributed, at least partially, to the increased capital employed figure. The funds raised likely haven't been put to work yet so it's worth watching what happens in the future with Sportradar Group's earnings and if they change as a result from the capital raise.
The Bottom Line
Even though returns on capital have fallen in the short term, we find it promising that revenue and capital employed have both increased for Sportradar Group. These growth trends haven't led to growth returns though, since the stock has fallen 63% over the last year. So we think it'd be worthwhile to look further into this stock given the trends look encouraging.
While Sportradar Group doesn't shine too bright in this respect, it's still worth seeing if the company is trading at attractive prices. You can find that out with our FREE intrinsic value estimation on our platform.
While Sportradar Group isn't earning the highest return, check out this free list of companies that are earning high returns on equity with solid balance sheets.
Have feedback on this article? Concerned about the content? Get in touch with us directly. Alternatively, email editorial-team (at) simplywallst.com.
This article by Simply Wall St is general in nature. We provide commentary based on historical data and analyst forecasts only using an unbiased methodology and our articles are not intended to be financial advice. It does not constitute a recommendation to buy or sell any stock, and does not take account of your objectives, or your financial situation. We aim to bring you long-term focused analysis driven by fundamental data. Note that our analysis may not factor in the latest price-sensitive company announcements or qualitative material. Simply Wall St has no position in any stocks mentioned.
Join A Paid User Research Session
You’ll receive a US$30 Amazon Gift card for 1 hour of your time while helping us build better investing tools for the individual investors like yourself. Sign up here
