
 Yahoo Finance
 Spectrum Brands (SPB) Stock Down on Q1 Earnings & Sales Miss
Spectrum Brands Holdings Inc. SPB stock fell almost 2%, following lower-than-expected top and bottom-line results in first-quarter fiscal 2020. Moreover, both metrics declined year over year.
Although the company witnessed organic growth in Home & Personal Care, and Global Pet Care; unfavorable timing-related issues in Home & Garden, and Hardware & Home Improvement segments hurt quarterly results. Further, sluggishness in adjusted EBITDA was due to additional tariffs, which more than offset productivity improvements. However, the company foresees net sales; adjusted earnings before interest, taxes, depreciation and amortization (EBITDA); and free cash flow growth for fiscal 2020.
Q1 in Detail
Adjusted earnings from continuing operations of 20 cents per share lagged the Zacks Consensus Estimate of 35 cents. The bottom line also declined 4.4%, owing to high tariffs as well as rise in manufacturing and stranded costs, partly offset by fall in interest expenses and shares outstanding.
Spectrum Brands’ net sales decreased 1% year over year to $872 million, missing the Zacks Consensus Estimate of $896 million. Excluding the negative impacts of currency; organic net sales edged down 0.3%, owing to lower sales in Home & Garden, and Hardware & Home Improvement segments. This was somewhat offset by higher sales at Home & Personal Care, and Global Pet Care.
Gross profit dipped 12% year over year to $269.1 million. Moreover, gross margin contracted 380 bps to 30.9%, mainly driven by rise in tariffs and restructuring costs related to Global Productivity Improvement Plan, accelerated depreciation, and unfavorable timing of capitalized manufacturing variances. However, the decline was partly offset by favorable pricing and productivity.
Furthermore, the Zacks Rank #4 (Sell) company reported operating loss of $45.9 million against operating income of $25.2 million in the year-ago period.
Adjusted EBITDA from continuing operations declined 11.4% to $102.2 million in the fiscal first quarter. Further, adjusted EBITDA margin contracted 140 bps on high tariffs along with rise in manufacturing and stranded costs. This was partly mitigated by favorable pricing and productivity.
Segmental Performance
Sales at the Hardware & Home Improvement segment fell 2.4% to $297.7 million mainly due to a decline in residential security and builders’ hardware, offset by an increase in plumbing. The segment’s organic sales dipped 2.5% year over year. Also, adjusted EBITDA at the segment grew 23% to $42.8 million.
Sales at the Home & Personal Care segment inched up 1.5% to $322.1 million, backed by growth at personal care and small appliances in Europe. However, fell at the U.S. personal care and small appliances witnessed sales decline along with decreases in department store and specialty channels. Excluding the adverse impacts of foreign currency, organic net sales for the segment increased 3.2%. Moreover, the segment’s adjusted EBITDA of $36.4 million improved 4% on productivity improvements and higher volumes.
The Global Pet Care segment’s sales grew 0.5% year over year to $205.8 million, primarily driven by robust growth in U.S. companion animal revenues as well as higher sales in Europe aquatics and companion animal. This was partly compensated with a decline in U.S. aquatics. Excluding the adverse impacts of foreign currency, organic sales rose 1.1%. Further, the segment’s adjusted EBITDA grew 8.2% to $31.5 million.
The Home & Garden segment’s sales dropped 13.9% to $45.9 million mainly on lower sales in household insect controls and repellents. This was somewhat compensated with growth in outdoor controls. Further, the segment’s adjusted EBITDA fell to a loss of $3.3 million against $3.1 million gain reported in the prior-year quarter.
Spectrum Brands Holdings Inc. Price, Consensus and EPS Surprise
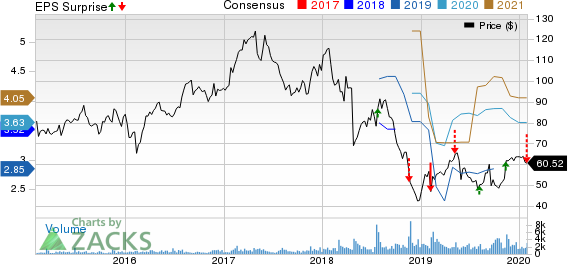
Spectrum Brands Holdings Inc. price-consensus-eps-surprise-chart | Spectrum Brands Holdings Inc. Quote
Other Financials
Spectrum Brands ended the quarter with cash and cash equivalents of $142.2 million, and roughly $678 million available under its $800-million Cash Flow Revolver. As of Dec 29, 2019, the company’s outstanding debt was nearly $2,369 million.
It repurchased 1.3 million shares worth $81.4 million as part of its $125-million accelerated share repurchase program. In the reported quarter, capital expenditure was $18.7 million.
Business Development
The company entered an agreement to divest its dog and cat food manufacturing operations in Coevorden, The Netherlands. The move is part of Spectrum Brand’s plans to exit its underperforming businesses to focus on core brands. Apart from this, the company is progressing well with its Global Productivity Improvement Plan, which will lead to savings of more than $100 million in the next 15-18 months.
Fiscal 2020 Guidance
Spectrum Brands reiterated its outlook for fiscal 2020. It still projects reported net sales growth in low-single digits. Depending on existing rates, foreign currency translations are expected to hurt the top line marginally.
Further, the company continues to project adjusted EBITDA of $570-$590 million. It anticipates adjusted free cash flow of $240-$260 million. Also, capital expenditure is envisioned to be $90-$100 million.
Price Performance
In the past three months, shares of the company have gained 20.5% against the industry’s 1.8% decline.

Some Better-Ranked Consumer Discretionary Stocks
Guess, Inc. GES has an expected long-term earnings growth rate of 17.5%. The company currently sports a Zacks Rank #1 (Strong Buy). You can see the complete list of today’s Zacks #1 Rank stocks here.
Ralph Lauren Corporation RL has an expected long-term earnings growth rate of 8.4%. The company currently carries a Zacks Rank #2 (Buy).
lululemon athletica inc. LULU, also a Zacks Rank #2 stock, has an expected long-term earnings growth rate of 18.9%.
Today's Best Stocks from Zacks
Would you like to see the updated picks from our best market-beating strategies? From 2017 through 2019, while the S&P 500 gained and impressive +53.6%, five of our strategies returned +65.8%, +97.1%, +118.0%, +175.7% and even +186.7%.
This outperformance has not just been a recent phenomenon. From 2000 – 2019, while the S&P averaged +6.0% per year, our top strategies averaged up to +54.7% per year.
See their latest picks free >>
Want the latest recommendations from Zacks Investment Research? Today, you can download 7 Best Stocks for the Next 30 Days. Click to get this free report
Spectrum Brands Holdings Inc. (SPB) : Free Stock Analysis Report
lululemon athletica inc. (LULU) : Free Stock Analysis Report
Guess?, Inc. (GES) : Free Stock Analysis Report
Ralph Lauren Corporation (RL) : Free Stock Analysis Report
To read this article on Zacks.com click here.
Zacks Investment Research
