
 Yahoo Finance
 Spartan Delta (TSE:SDE) pulls back 4.0% this week, but still delivers shareholders incredible 99% CAGR over 3 years
Spartan Delta Corp. (TSE:SDE) shareholders have seen the share price descend 25% over the month. But that doesn't displace its brilliant performance over three years. Indeed, the share price is up a whopping 691% in that time. So the recent fall doesn't do much to dampen our respect for the business. The share price action could signify that the business itself is dramatically improved, in that time. It really delights us to see such great share price performance for investors.
In light of the stock dropping 4.0% in the past week, we want to investigate the longer term story, and see if fundamentals have been the driver of the company's positive three-year return.
See our latest analysis for Spartan Delta
While the efficient markets hypothesis continues to be taught by some, it has been proven that markets are over-reactive dynamic systems, and investors are not always rational. One flawed but reasonable way to assess how sentiment around a company has changed is to compare the earnings per share (EPS) with the share price.
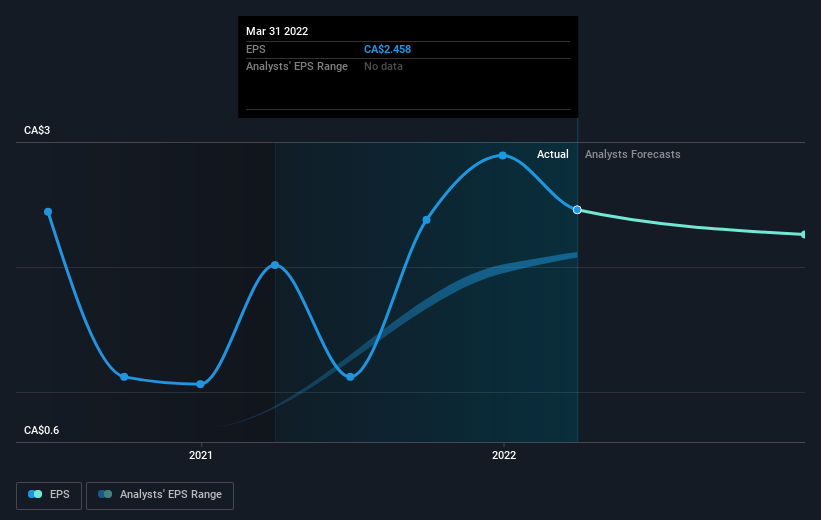
During three years of share price growth, Spartan Delta moved from a loss to profitability. Given the importance of this milestone, it's not overly surprising that the share price has increased strongly.
You can see how EPS has changed over time in the image below (click on the chart to see the exact values).
It is of course excellent to see how Spartan Delta has grown profits over the years, but the future is more important for shareholders. This free interactive report on Spartan Delta's balance sheet strength is a great place to start, if you want to investigate the stock further.
A Different Perspective
It's nice to see that Spartan Delta shareholders have received a total shareholder return of 110% over the last year. Since the one-year TSR is better than the five-year TSR (the latter coming in at 10% per year), it would seem that the stock's performance has improved in recent times. Given the share price momentum remains strong, it might be worth taking a closer look at the stock, lest you miss an opportunity. While it is well worth considering the different impacts that market conditions can have on the share price, there are other factors that are even more important. Even so, be aware that Spartan Delta is showing 5 warning signs in our investment analysis , and 1 of those is significant...
If you are like me, then you will not want to miss this free list of growing companies that insiders are buying.
Please note, the market returns quoted in this article reflect the market weighted average returns of stocks that currently trade on CA exchanges.
Have feedback on this article? Concerned about the content? Get in touch with us directly. Alternatively, email editorial-team (at) simplywallst.com.
This article by Simply Wall St is general in nature. We provide commentary based on historical data and analyst forecasts only using an unbiased methodology and our articles are not intended to be financial advice. It does not constitute a recommendation to buy or sell any stock, and does not take account of your objectives, or your financial situation. We aim to bring you long-term focused analysis driven by fundamental data. Note that our analysis may not factor in the latest price-sensitive company announcements or qualitative material. Simply Wall St has no position in any stocks mentioned.
Join A Paid User Research Session
You’ll receive a US$30 Amazon Gift card for 1 hour of your time while helping us build better investing tools for the individual investors like yourself. Sign up here
