
 Yahoo Finance
 Is SM Energy (NYSE:SM) A Risky Investment?

Warren Buffett famously said, 'Volatility is far from synonymous with risk.' When we think about how risky a company is, we always like to look at its use of debt, since debt overload can lead to ruin. We can see that SM Energy Company (NYSE:SM) does use debt in its business. But the real question is whether this debt is making the company risky.
When Is Debt A Problem?
Debt assists a business until the business has trouble paying it off, either with new capital or with free cash flow. Part and parcel of capitalism is the process of 'creative destruction' where failed businesses are mercilessly liquidated by their bankers. However, a more common (but still painful) scenario is that it has to raise new equity capital at a low price, thus permanently diluting shareholders. By replacing dilution, though, debt can be an extremely good tool for businesses that need capital to invest in growth at high rates of return. When we examine debt levels, we first consider both cash and debt levels, together.
Check out our latest analysis for SM Energy
What Is SM Energy's Debt?
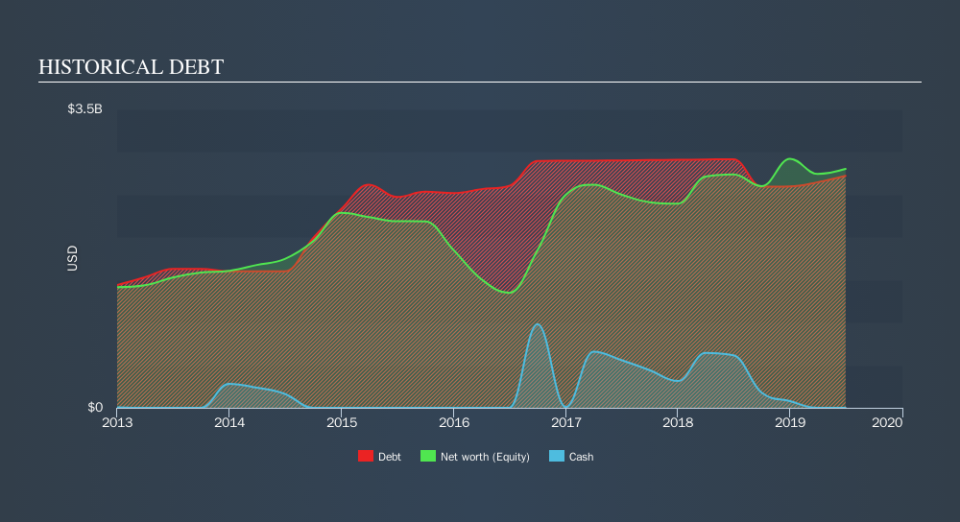
As you can see below, SM Energy had US$2.72b of debt at June 2019, down from US$2.92b a year prior. Net debt is about the same, since the it doesn't have much cash.
A Look At SM Energy's Liabilities
Zooming in on the latest balance sheet data, we can see that SM Energy had liabilities of US$503.9m due within 12 months and liabilities of US$3.09b due beyond that. On the other hand, it had cash of US$12.0k and US$165.8m worth of receivables due within a year. So it has liabilities totalling US$3.42b more than its cash and near-term receivables, combined.
The deficiency here weighs heavily on the US$963.8m company itself, as if a child were struggling under the weight of an enormous back-pack full of books, his sports gear, and a trumpet." So we'd watch its balance sheet closely, without a doubt After all, SM Energy would likely require a major re-capitalisation if it had to pay its creditors today.
We use two main ratios to inform us about debt levels relative to earnings. The first is net debt divided by earnings before interest, tax, depreciation, and amortization (EBITDA), while the second is how many times its earnings before interest and tax (EBIT) covers its interest expense (or its interest cover, for short). Thus we consider debt relative to earnings both with and without depreciation and amortization expenses.
While we wouldn't worry about SM Energy's net debt to EBITDA ratio of 2.6, we think its super-low interest cover of 1.6 times is a sign of high leverage. It seems that the business incurs large depreciation and amortisation charges, so maybe its debt load is heavier than it would first appear, since EBITDA is arguably a generous measure of earnings. It seems clear that the cost of borrowing money is negatively impacting returns for shareholders, of late. One redeeming factor for SM Energy is that it turned last year's EBIT loss into a gain of US$238m, over the last twelve months. When analysing debt levels, the balance sheet is the obvious place to start. But it is future earnings, more than anything, that will determine SM Energy's ability to maintain a healthy balance sheet going forward. So if you want to see what the professionals think, you might find this free report on analyst profit forecasts to be interesting.
Finally, a company can only pay off debt with cold hard cash, not accounting profits. So it is important to check how much of its earnings before interest and tax (EBIT) converts to actual free cash flow. Over the last year, SM Energy saw substantial negative free cash flow, in total. While investors are no doubt expecting a reversal of that situation in due course, it clearly does mean its use of debt is more risky.
Our View
To be frank both SM Energy's conversion of EBIT to free cash flow and its track record of staying on top of its total liabilities make us rather uncomfortable with its debt levels. Having said that, its ability to grow its EBIT isn't such a worry. Taking into account all the aforementioned factors, it looks like SM Energy has too much debt. While some investors love that sort of risky play, it's certainly not our cup of tea. Given our concerns about SM Energy's debt levels, it seems only prudent to check if insiders have been ditching the stock.
At the end of the day, it's often better to focus on companies that are free from net debt. You can access our special list of such companies (all with a track record of profit growth). It's free.
We aim to bring you long-term focused research analysis driven by fundamental data. Note that our analysis may not factor in the latest price-sensitive company announcements or qualitative material.
If you spot an error that warrants correction, please contact the editor at editorial-team@simplywallst.com. This article by Simply Wall St is general in nature. It does not constitute a recommendation to buy or sell any stock, and does not take account of your objectives, or your financial situation. Simply Wall St has no position in the stocks mentioned. Thank you for reading.
