
 Yahoo Finance
 Slowing Rates Of Return At Flowserve (NYSE:FLS) Leave Little Room For Excitement
If we want to find a stock that could multiply over the long term, what are the underlying trends we should look for? One common approach is to try and find a company with returns on capital employed (ROCE) that are increasing, in conjunction with a growing amount of capital employed. Put simply, these types of businesses are compounding machines, meaning they are continually reinvesting their earnings at ever-higher rates of return. However, after investigating Flowserve (NYSE:FLS), we don't think it's current trends fit the mold of a multi-bagger.
Understanding Return On Capital Employed (ROCE)
For those who don't know, ROCE is a measure of a company's yearly pre-tax profit (its return), relative to the capital employed in the business. Analysts use this formula to calculate it for Flowserve:
Return on Capital Employed = Earnings Before Interest and Tax (EBIT) ÷ (Total Assets - Current Liabilities)
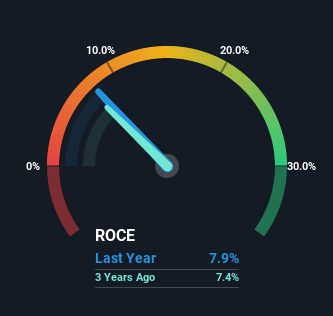
0.079 = US$285m ÷ (US$4.7b - US$1.1b) (Based on the trailing twelve months to December 2021).
Therefore, Flowserve has an ROCE of 7.9%. Ultimately, that's a low return and it under-performs the Machinery industry average of 10%.
Check out our latest analysis for Flowserve
Above you can see how the current ROCE for Flowserve compares to its prior returns on capital, but there's only so much you can tell from the past. If you'd like to see what analysts are forecasting going forward, you should check out our free report for Flowserve.
The Trend Of ROCE
Over the past five years, Flowserve's ROCE and capital employed have both remained mostly flat. It's not uncommon to see this when looking at a mature and stable business that isn't re-investing its earnings because it has likely passed that phase of the business cycle. So unless we see a substantial change at Flowserve in terms of ROCE and additional investments being made, we wouldn't hold our breath on it being a multi-bagger. This probably explains why Flowserve is paying out 34% of its income to shareholders in the form of dividends. Given the business isn't reinvesting in itself, it makes sense to distribute a portion of earnings among shareholders.
The Key Takeaway
In summary, Flowserve isn't compounding its earnings but is generating stable returns on the same amount of capital employed. And in the last five years, the stock has given away 27% so the market doesn't look too hopeful on these trends strengthening any time soon. All in all, the inherent trends aren't typical of multi-baggers, so if that's what you're after, we think you might have more luck elsewhere.
One more thing, we've spotted 1 warning sign facing Flowserve that you might find interesting.
For those who like to invest in solid companies, check out this free list of companies with solid balance sheets and high returns on equity.
Have feedback on this article? Concerned about the content? Get in touch with us directly. Alternatively, email editorial-team (at) simplywallst.com.
This article by Simply Wall St is general in nature. We provide commentary based on historical data and analyst forecasts only using an unbiased methodology and our articles are not intended to be financial advice. It does not constitute a recommendation to buy or sell any stock, and does not take account of your objectives, or your financial situation. We aim to bring you long-term focused analysis driven by fundamental data. Note that our analysis may not factor in the latest price-sensitive company announcements or qualitative material. Simply Wall St has no position in any stocks mentioned.
