
 Yahoo Finance
 Slowing Rates Of Return At Check Point Software Technologies (NASDAQ:CHKP) Leave Little Room For Excitement
Finding a business that has the potential to grow substantially is not easy, but it is possible if we look at a few key financial metrics. Amongst other things, we'll want to see two things; firstly, a growing return on capital employed (ROCE) and secondly, an expansion in the company's amount of capital employed. Put simply, these types of businesses are compounding machines, meaning they are continually reinvesting their earnings at ever-higher rates of return. Having said that, while the ROCE is currently high for Check Point Software Technologies (NASDAQ:CHKP), we aren't jumping out of our chairs because returns are decreasing.
What is Return On Capital Employed (ROCE)?
Just to clarify if you're unsure, ROCE is a metric for evaluating how much pre-tax income (in percentage terms) a company earns on the capital invested in its business. To calculate this metric for Check Point Software Technologies, this is the formula:
Return on Capital Employed = Earnings Before Interest and Tax (EBIT) ÷ (Total Assets - Current Liabilities)
0.22 = US$913m ÷ (US$5.7b - US$1.5b) (Based on the trailing twelve months to September 2021).
So, Check Point Software Technologies has an ROCE of 22%. In absolute terms that's a great return and it's even better than the Software industry average of 11%.
View our latest analysis for Check Point Software Technologies
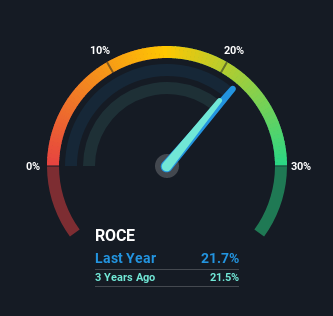
Above you can see how the current ROCE for Check Point Software Technologies compares to its prior returns on capital, but there's only so much you can tell from the past. If you'd like to see what analysts are forecasting going forward, you should check out our free report for Check Point Software Technologies.
How Are Returns Trending?
There hasn't been much to report for Check Point Software Technologies' returns and its level of capital employed because both metrics have been steady for the past five years. This tells us the company isn't reinvesting in itself, so it's plausible that it's past the growth phase. Although current returns are high, we'd need more evidence of underlying growth for it to look like a multi-bagger going forward.
The Bottom Line
While Check Point Software Technologies has impressive profitability from its capital, it isn't increasing that amount of capital. Unsurprisingly, the stock has only gained 39% over the last five years, which potentially indicates that investors are accounting for this going forward. As a result, if you're hunting for a multi-bagger, we think you'd have more luck elsewhere.
Check Point Software Technologies could be trading at an attractive price in other respects, so you might find our free intrinsic value estimation on our platform quite valuable.
If you want to search for more stocks that have been earning high returns, check out this free list of stocks with solid balance sheets that are also earning high returns on equity.
This article by Simply Wall St is general in nature. We provide commentary based on historical data and analyst forecasts only using an unbiased methodology and our articles are not intended to be financial advice. It does not constitute a recommendation to buy or sell any stock, and does not take account of your objectives, or your financial situation. We aim to bring you long-term focused analysis driven by fundamental data. Note that our analysis may not factor in the latest price-sensitive company announcements or qualitative material. Simply Wall St has no position in any stocks mentioned.
Have feedback on this article? Concerned about the content? Get in touch with us directly. Alternatively, email editorial-team (at) simplywallst.com.
