
 Yahoo Finance
 A Sliding Share Price Has Us Looking At Kirby Corporation's (NYSE:KEX) P/E Ratio

To the annoyance of some shareholders, Kirby (NYSE:KEX) shares are down a considerable 49% in the last month. That drop has capped off a tough year for shareholders, with the share price down 50% in that time.
All else being equal, a share price drop should make a stock more attractive to potential investors. In the long term, share prices tend to follow earnings per share, but in the short term prices bounce around in response to short term factors (which are not always obvious). The implication here is that long term investors have an opportunity when expectations of a company are too low. Perhaps the simplest way to get a read on investors' expectations of a business is to look at its Price to Earnings Ratio (PE Ratio). A high P/E implies that investors have high expectations of what a company can achieve compared to a company with a low P/E ratio.
Check out our latest analysis for Kirby
How Does Kirby's P/E Ratio Compare To Its Peers?
We can tell from its P/E ratio of 16.03 that there is some investor optimism about Kirby. The image below shows that Kirby has a higher P/E than the average (6.1) P/E for companies in the shipping industry.
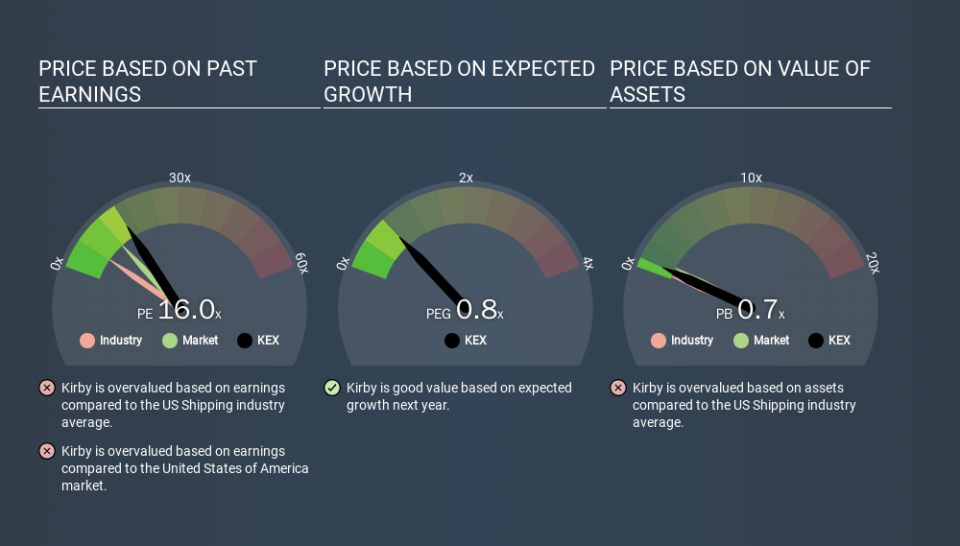
Its relatively high P/E ratio indicates that Kirby shareholders think it will perform better than other companies in its industry classification. Shareholders are clearly optimistic, but the future is always uncertain. So investors should delve deeper. I like to check if company insiders have been buying or selling.
How Growth Rates Impact P/E Ratios
Companies that shrink earnings per share quickly will rapidly decrease the 'E' in the equation. That means even if the current P/E is low, it will increase over time if the share price stays flat. So while a stock may look cheap based on past earnings, it could be expensive based on future earnings.
In the last year, Kirby grew EPS like Taylor Swift grew her fan base back in 2010; the 81% gain was both fast and well deserved. Unfortunately, earnings per share are down 14% a year, over 5 years.
A Limitation: P/E Ratios Ignore Debt and Cash In The Bank
Don't forget that the P/E ratio considers market capitalization. So it won't reflect the advantage of cash, or disadvantage of debt. Theoretically, a business can improve its earnings (and produce a lower P/E in the future) by investing in growth. That means taking on debt (or spending its cash).
Such expenditure might be good or bad, in the long term, but the point here is that the balance sheet is not reflected by this ratio.
Is Debt Impacting Kirby's P/E?
Kirby has net debt worth 61% of its market capitalization. This is a reasonably significant level of debt -- all else being equal you'd expect a much lower P/E than if it had net cash.
The Verdict On Kirby's P/E Ratio
Kirby's P/E is 16.0 which is above average (11.5) in its market. Its meaningful level of debt should warrant a lower P/E ratio, but the fast EPS growth is a positive. So it seems likely the market is overlooking the debt because of the fast earnings growth. Given Kirby's P/E ratio has declined from 31.2 to 16.0 in the last month, we know for sure that the market is significantly less confident about the business today, than it was back then. For those who don't like to trade against momentum, that could be a warning sign, but a contrarian investor might want to take a closer look.
When the market is wrong about a stock, it gives savvy investors an opportunity. People often underestimate remarkable growth -- so investors can make money when fast growth is not fully appreciated. So this free visualization of the analyst consensus on future earnings could help you make the right decision about whether to buy, sell, or hold.
But note: Kirby may not be the best stock to buy. So take a peek at this free list of interesting companies with strong recent earnings growth (and a P/E ratio below 20).
If you spot an error that warrants correction, please contact the editor at editorial-team@simplywallst.com. This article by Simply Wall St is general in nature. It does not constitute a recommendation to buy or sell any stock, and does not take account of your objectives, or your financial situation. Simply Wall St has no position in the stocks mentioned.
We aim to bring you long-term focused research analysis driven by fundamental data. Note that our analysis may not factor in the latest price-sensitive company announcements or qualitative material. Thank you for reading.
