
 Yahoo Finance
 A Sliding Share Price Has Us Looking At Callaway Golf Company's (NYSE:ELY) P/E Ratio

Unfortunately for some shareholders, the Callaway Golf (NYSE:ELY) share price has dived 31% in the last thirty days. The recent drop has obliterated the annual return, with the share price now down 17% over that longer period.
Assuming nothing else has changed, a lower share price makes a stock more attractive to potential buyers. In the long term, share prices tend to follow earnings per share, but in the short term prices bounce around in response to short term factors (which are not always obvious). The implication here is that long term investors have an opportunity when expectations of a company are too low. Perhaps the simplest way to get a read on investors' expectations of a business is to look at its Price to Earnings Ratio (PE Ratio). A high P/E ratio means that investors have a high expectation about future growth, while a low P/E ratio means they have low expectations about future growth.
See our latest analysis for Callaway Golf
How Does Callaway Golf's P/E Ratio Compare To Its Peers?
We can tell from its P/E ratio of 16.89 that there is some investor optimism about Callaway Golf. As you can see below, Callaway Golf has a higher P/E than the average company (15.1) in the leisure industry.
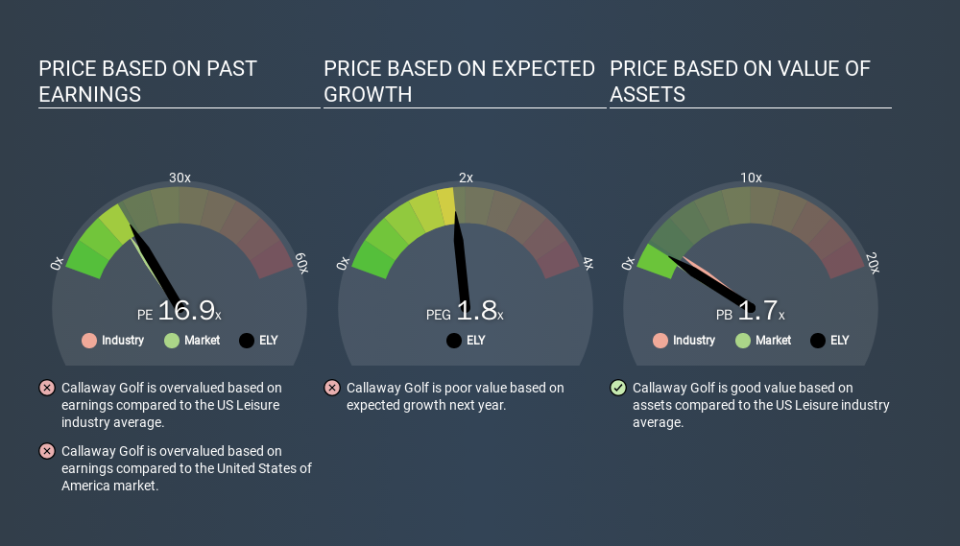
That means that the market expects Callaway Golf will outperform other companies in its industry. The market is optimistic about the future, but that doesn't guarantee future growth. So further research is always essential. I often monitor director buying and selling.
How Growth Rates Impact P/E Ratios
Companies that shrink earnings per share quickly will rapidly decrease the 'E' in the equation. Therefore, even if you pay a low multiple of earnings now, that multiple will become higher in the future. Then, a higher P/E might scare off shareholders, pushing the share price down.
Callaway Golf saw earnings per share decrease by 24% last year. But EPS is up 32% over the last 5 years. And it has shrunk its earnings per share by 25% per year over the last three years. This growth rate might warrant a low P/E ratio.
A Limitation: P/E Ratios Ignore Debt and Cash In The Bank
One drawback of using a P/E ratio is that it considers market capitalization, but not the balance sheet. That means it doesn't take debt or cash into account. Theoretically, a business can improve its earnings (and produce a lower P/E in the future) by investing in growth. That means taking on debt (or spending its cash).
Such spending might be good or bad, overall, but the key point here is that you need to look at debt to understand the P/E ratio in context.
How Does Callaway Golf's Debt Impact Its P/E Ratio?
Callaway Golf has net debt equal to 37% of its market cap. While that's enough to warrant consideration, it doesn't really concern us.
The Verdict On Callaway Golf's P/E Ratio
Callaway Golf trades on a P/E ratio of 16.9, which is above its market average of 15.3. With modest debt but no EPS growth in the last year, it's fair to say the P/E implies some optimism about future earnings, from the market. What can be absolutely certain is that the market has become significantly less optimistic about Callaway Golf over the last month, with the P/E ratio falling from 24.5 back then to 16.9 today. For those who don't like to trade against momentum, that could be a warning sign, but a contrarian investor might want to take a closer look.
Investors have an opportunity when market expectations about a stock are wrong. If the reality for a company is better than it expects, you can make money by buying and holding for the long term. So this free visualization of the analyst consensus on future earnings could help you make the right decision about whether to buy, sell, or hold.
But note: Callaway Golf may not be the best stock to buy. So take a peek at this free list of interesting companies with strong recent earnings growth (and a P/E ratio below 20).
If you spot an error that warrants correction, please contact the editor at editorial-team@simplywallst.com. This article by Simply Wall St is general in nature. It does not constitute a recommendation to buy or sell any stock, and does not take account of your objectives, or your financial situation. Simply Wall St has no position in the stocks mentioned.
We aim to bring you long-term focused research analysis driven by fundamental data. Note that our analysis may not factor in the latest price-sensitive company announcements or qualitative material. Thank you for reading.
