
 Yahoo Finance
 A Sliding Share Price Has Us Looking At Canadian Natural Resources Limited's (TSE:CNQ) P/E Ratio

To the annoyance of some shareholders, Canadian Natural Resources (TSE:CNQ) shares are down a considerable 69% in the last month. Given the 67% drop over the last year, some shareholders might be worried that they have become bagholders. What is a bagholder? It is a shareholder who has suffered a bad loss, but continues to hold indefinitely, without questioning their reasons for holding, even as the losses grow greater.
Assuming nothing else has changed, a lower share price makes a stock more attractive to potential buyers. In the long term, share prices tend to follow earnings per share, but in the short term prices bounce around in response to short term factors (which are not always obvious). The implication here is that long term investors have an opportunity when expectations of a company are too low. One way to gauge market expectations of a stock is to look at its Price to Earnings Ratio (PE Ratio). Investors have optimistic expectations of companies with higher P/E ratios, compared to companies with lower P/E ratios.
Check out our latest analysis for Canadian Natural Resources
How Does Canadian Natural Resources's P/E Ratio Compare To Its Peers?
We can tell from its P/E ratio of 2.68 that sentiment around Canadian Natural Resources isn't particularly high. We can see in the image below that the average P/E (5.7) for companies in the oil and gas industry is higher than Canadian Natural Resources's P/E.
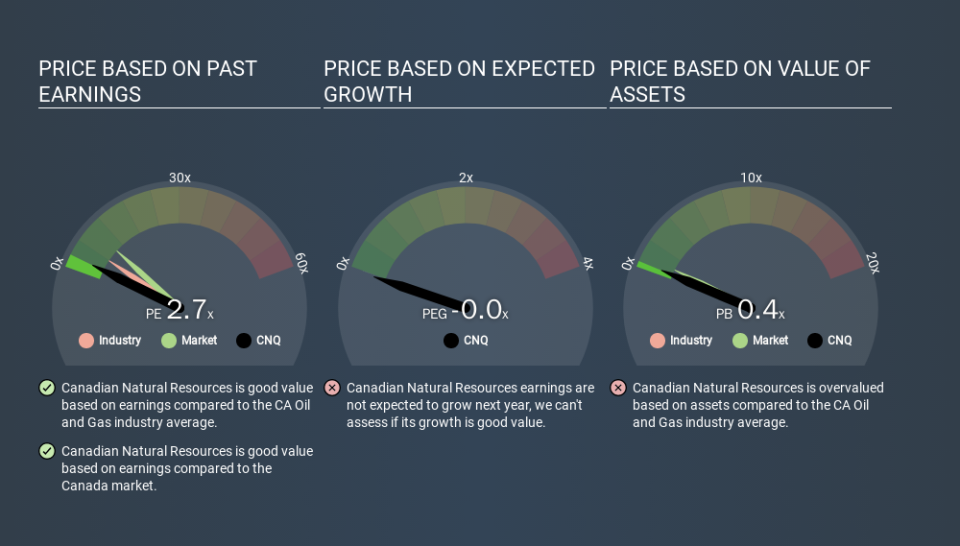
Canadian Natural Resources's P/E tells us that market participants think it will not fare as well as its peers in the same industry. Many investors like to buy stocks when the market is pessimistic about their prospects. It is arguably worth checking if insiders are buying shares, because that might imply they believe the stock is undervalued.
How Growth Rates Impact P/E Ratios
P/E ratios primarily reflect market expectations around earnings growth rates. If earnings are growing quickly, then the 'E' in the equation will increase faster than it would otherwise. And in that case, the P/E ratio itself will drop rather quickly. A lower P/E should indicate the stock is cheap relative to others -- and that may attract buyers.
In the last year, Canadian Natural Resources grew EPS like Taylor Swift grew her fan base back in 2010; the 114% gain was both fast and well deserved.
Remember: P/E Ratios Don't Consider The Balance Sheet
It's important to note that the P/E ratio considers the market capitalization, not the enterprise value. Thus, the metric does not reflect cash or debt held by the company. Hypothetically, a company could reduce its future P/E ratio by spending its cash (or taking on debt) to achieve higher earnings.
Spending on growth might be good or bad a few years later, but the point is that the P/E ratio does not account for the option (or lack thereof).
How Does Canadian Natural Resources's Debt Impact Its P/E Ratio?
Canadian Natural Resources has net debt worth a very significant 142% of its market capitalization. This is a relatively high level of debt, so the stock probably deserves a relatively low P/E ratio. Keep that in mind when comparing it to other companies.
The Bottom Line On Canadian Natural Resources's P/E Ratio
Canadian Natural Resources's P/E is 2.7 which is below average (9.2) in the CA market. While the EPS growth last year was strong, the significant debt levels reduce the number of options available to management. If the company can continue to grow earnings, then the current P/E may be unjustifiably low. Given Canadian Natural Resources's P/E ratio has declined from 8.8 to 2.7 in the last month, we know for sure that the market is more worried about the business today, than it was back then. For those who prefer invest in growth, this stock apparently offers limited promise, but the deep value investors may find the pessimism around this stock enticing.
Investors have an opportunity when market expectations about a stock are wrong. If it is underestimating a company, investors can make money by buying and holding the shares until the market corrects itself. So this free report on the analyst consensus forecasts could help you make a master move on this stock.
Of course you might be able to find a better stock than Canadian Natural Resources. So you may wish to see this free collection of other companies that have grown earnings strongly.
If you spot an error that warrants correction, please contact the editor at editorial-team@simplywallst.com. This article by Simply Wall St is general in nature. It does not constitute a recommendation to buy or sell any stock, and does not take account of your objectives, or your financial situation. Simply Wall St has no position in the stocks mentioned.
We aim to bring you long-term focused research analysis driven by fundamental data. Note that our analysis may not factor in the latest price-sensitive company announcements or qualitative material. Thank you for reading.
