
 Yahoo Finance
 A Sliding Share Price Has Us Looking At ACI Worldwide, Inc.'s (NASDAQ:ACIW) P/E Ratio

To the annoyance of some shareholders, ACI Worldwide (NASDAQ:ACIW) shares are down a considerable 36% in the last month. That drop has capped off a tough year for shareholders, with the share price down 31% in that time.
All else being equal, a share price drop should make a stock more attractive to potential investors. While the market sentiment towards a stock is very changeable, in the long run, the share price will tend to move in the same direction as earnings per share. So, on certain occasions, long term focussed investors try to take advantage of pessimistic expectations to buy shares at a better price. Perhaps the simplest way to get a read on investors' expectations of a business is to look at its Price to Earnings Ratio (PE Ratio). Investors have optimistic expectations of companies with higher P/E ratios, compared to companies with lower P/E ratios.
View our latest analysis for ACI Worldwide
Does ACI Worldwide Have A Relatively High Or Low P/E For Its Industry?
We can tell from its P/E ratio of 39.57 that there is some investor optimism about ACI Worldwide. You can see in the image below that the average P/E (33.7) for companies in the software industry is lower than ACI Worldwide's P/E.
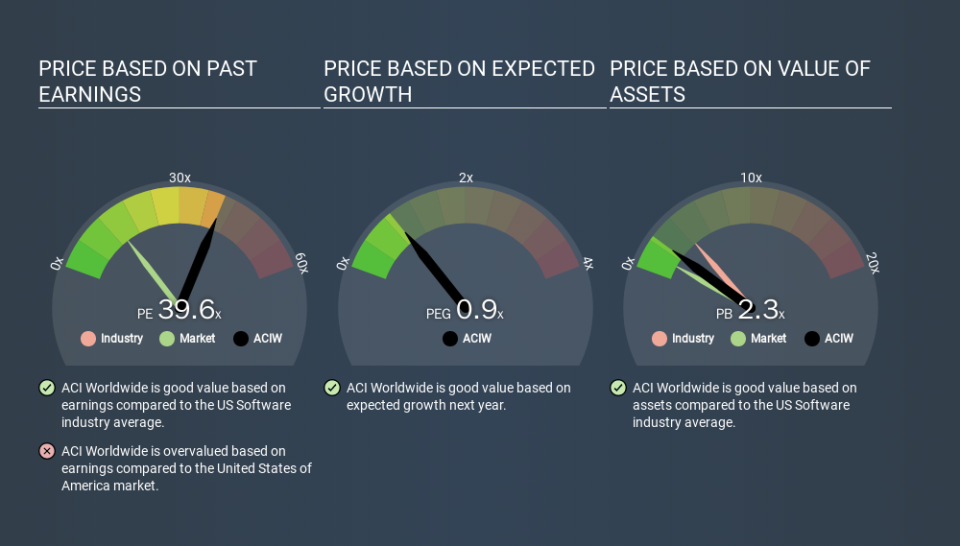
ACI Worldwide's P/E tells us that market participants think the company will perform better than its industry peers, going forward. The market is optimistic about the future, but that doesn't guarantee future growth. So further research is always essential. I often monitor director buying and selling.
How Growth Rates Impact P/E Ratios
When earnings fall, the 'E' decreases, over time. Therefore, even if you pay a low multiple of earnings now, that multiple will become higher in the future. Then, a higher P/E might scare off shareholders, pushing the share price down.
ACI Worldwide's earnings per share fell by 2.8% in the last twelve months. And over the longer term (3 years) earnings per share have decreased 19% annually. So we might expect a relatively low P/E.
Remember: P/E Ratios Don't Consider The Balance Sheet
One drawback of using a P/E ratio is that it considers market capitalization, but not the balance sheet. In other words, it does not consider any debt or cash that the company may have on the balance sheet. In theory, a company can lower its future P/E ratio by using cash or debt to invest in growth.
Such spending might be good or bad, overall, but the key point here is that you need to look at debt to understand the P/E ratio in context.
Is Debt Impacting ACI Worldwide's P/E?
ACI Worldwide's net debt equates to 48% of its market capitalization. While that's enough to warrant consideration, it doesn't really concern us.
The Verdict On ACI Worldwide's P/E Ratio
ACI Worldwide's P/E is 39.6 which is way above average (12.7) in its market. With a bit of debt, but a lack of recent growth, it's safe to say the market is expecting improved profit performance from the company, in the next few years. Given ACI Worldwide's P/E ratio has declined from 62.3 to 39.6 in the last month, we know for sure that the market is significantly less confident about the business today, than it was back then. For those who don't like to trade against momentum, that could be a warning sign, but a contrarian investor might want to take a closer look.
Investors should be looking to buy stocks that the market is wrong about. If the reality for a company is better than it expects, you can make money by buying and holding for the long term. So this free report on the analyst consensus forecasts could help you make a master move on this stock.
Of course you might be able to find a better stock than ACI Worldwide. So you may wish to see this free collection of other companies that have grown earnings strongly.
If you spot an error that warrants correction, please contact the editor at editorial-team@simplywallst.com. This article by Simply Wall St is general in nature. It does not constitute a recommendation to buy or sell any stock, and does not take account of your objectives, or your financial situation. Simply Wall St has no position in the stocks mentioned.
We aim to bring you long-term focused research analysis driven by fundamental data. Note that our analysis may not factor in the latest price-sensitive company announcements or qualitative material. Thank you for reading.
