
 Yahoo Finance
 SiteOne Landscape Supply Inc (NYSE:SITE): Time For A Financial Health Check

Small-caps and large-caps are wildly popular among investors; however, mid-cap stocks, such as SiteOne Landscape Supply Inc (NYSE:SITE) with a market-capitalization of US$3.60b, rarely draw their attention. Despite this, the two other categories have lagged behind the risk-adjusted returns of commonly ignored mid-cap stocks. Let’s take a look at SITE’s debt concentration and assess their financial liquidity to get an idea of their ability to fund strategic acquisitions and grow through cyclical pressures. Note that this information is centred entirely on financial health and is a top-level understanding, so I encourage you to look further into SITE here. Check out our latest analysis for SiteOne Landscape Supply
How does SITE’s operating cash flow stack up against its debt?
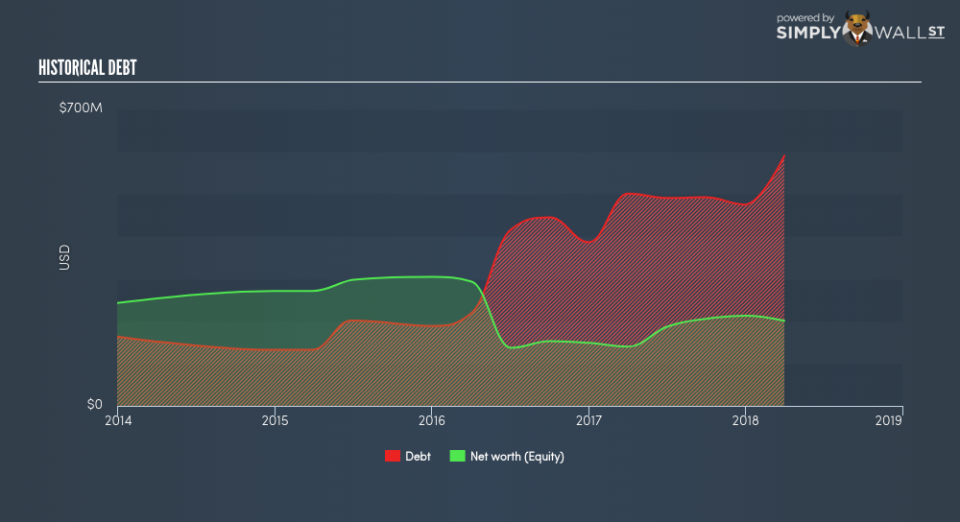
SITE’s debt levels surged from US$386.50m to US$475.30m over the last 12 months – this includes both the current and long-term debt. With this rise in debt, the current cash and short-term investment levels stands at US$16.70m for investing into the business. Moreover, SITE has generated cash from operations of US$16.30m over the same time period, resulting in an operating cash to total debt ratio of 3.43%, meaning that SITE’s operating cash is not sufficient to cover its debt. This ratio can also be interpreted as a measure of efficiency as an alternative to return on assets. In SITE’s case, it is able to generate 0.034x cash from its debt capital.
Does SITE’s liquid assets cover its short-term commitments?
At the current liabilities level of US$205.80m liabilities, the company has maintained a safe level of current assets to meet its obligations, with the current ratio last standing at 2.92x. Usually, for Trade Distributors companies, this is a suitable ratio since there’s sufficient cash cushion without leaving too much capital idle or in low-earning investments.
Does SITE face the risk of succumbing to its debt-load?
With total debt exceeding equities, SITE is considered a highly levered company. This is not unusual for mid-caps as debt tends to be a cheaper and faster source of funding for some businesses. We can test if SITE’s debt levels are sustainable by measuring interest payments against earnings of a company. Ideally, earnings before interest and tax (EBIT) should cover net interest by at least three times. For SITE, the ratio of 3.5x suggests that interest is appropriately covered, which means that debtors may be willing to loan the company more money, giving SITE ample headroom to grow its debt facilities.
Next Steps:
SITE’s debt and cash flow levels indicate room for improvement. Its cash flow coverage of less than a quarter of debt means that operating efficiency could be an issue. Though, the company will be able to pay all of its upcoming liabilities from its current short-term assets. I admit this is a fairly basic analysis for SITE’s financial health. Other important fundamentals need to be considered alongside. I recommend you continue to research SiteOne Landscape Supply to get a better picture of the stock by looking at:
Future Outlook: What are well-informed industry analysts predicting for SITE’s future growth? Take a look at our free research report of analyst consensus for SITE’s outlook.
Valuation: What is SITE worth today? Is the stock undervalued, even when its growth outlook is factored into its intrinsic value? The intrinsic value infographic in our free research report helps visualize whether SITE is currently mispriced by the market.
Other High-Performing Stocks: Are there other stocks that provide better prospects with proven track records? Explore our free list of these great stocks here.
To help readers see pass the short term volatility of the financial market, we aim to bring you a long-term focused research analysis purely driven by fundamental data. Note that our analysis does not factor in the latest price sensitive company announcements.
The author is an independent contributor and at the time of publication had no position in the stocks mentioned.
