
 Yahoo Finance
 Simon Property (SPG) Q4 FFO & Revenues Beat Estimates, NOI Up
Simon Property Group, Inc.’s SPG fourth-quarter 2019 funds from operations (FFO) per share of $2.96 surpassed the Zacks Consensus Estimate of $2.95. However, the reported tally comes in 8.4% lower than the year-ago quarter’s FFO of $3.23 per share.
Results reflect increase in leasing spread per square foot at the company’s U.S. malls and Premium Outlets.
Further, the company generated revenues of nearly $1.49 billion in the quarter, outpacing the Zacks Consensus Estimate of $1.47 billion. The revenue figure also comes in 1.9% higher than the prior-year quarter’s reported tally.
For full-year 2019, the FFO per share came in at $12.04, matching the Zacks Consensus Estimate but lower than the prior-year tally of $12.13. Moreover, revenues witnessed 1.9% year-over-year growth to $5.7 billion.
Inside the Headline Numbers
For the U.S. Malls and Premium Outlets portfolio, occupancy was 95.1% as of Dec 31, 2019. Retailer sales per square foot came in at $693 for the trailing 12-month period, marking 4.8% growth. Base minimum rent per square feet was $54.59 as of Dec 31, 2019. Furthermore, leasing spread per square foot for the trailing 12-month period ended Dec 31, 2019 increased 14.4% to $7.83.
Total portfolio net operating income (NOI) growth for the reported quarter came in at 1.7%. Comparable-property NOI growth for the same period came in at 1.7%.
At the end of fourth-quarter 2019, Simon Property had redevelopment and expansion projects, including the redevelopment of former department store spaces, ongoing at more than 30 properties in the United States, Asia and Europe. The company’s share of costs of all new development and redevelopment projects under construction was around $1.8 billion at the end of the reported quarter.
Balance Sheet Position
The company exited 2019 with cash and cash equivalents of $669.4 million compared with the $514.3 million reported at the end of December 2018.
Notably, during the October-December, the company accomplished a three-tranche senior notes offering, aggregating $3.5 billion, having a weighted average coupon rate of 2.61% and weighted average term of 15.9 years. Moreover, it retired all or part of four series of senior notes totaling around $2.6 billion (USD equivalent).
Simon Property had more than $7.1 billion of liquidity as of Dec 31, 2019. This comprised cash on hand, including available capacity under the company’s revolving credit facilities, and its share of joint-venture cash.
Outlook
Simon Property expects 2020 FFO per share in the range of $12.25-$12.40. The Zacks Consensus Estimate for the same is currently pinned at $12.62.
Dividend
The company also announced a quarterly dividend of $2.10 per share, flat sequentially, and up 2.4% year over year. This dividend will be paid on Feb 28, to stockholders of record as of Feb 14, 2020.
Our Viewpoint
In the December-end quarter, Simon Property reaped benefits of continued portfolio-strengthening efforts on innovative and disciplined investments in developments and redevelopments.
Furthermore, the company fortified its balance sheet. Throughout 2019, the company opportunistically tapped the debt market. This enabled the Simon Property to lower effective borrowing costs and extend its maturity profile.
However, shrinking footfall at malls amid shift of consumers toward online channels, store closures and bankruptcy of retailers will likely keep denting any robust growth of the company.
Simon Property Group, Inc. Price, Consensus and EPS Surprise
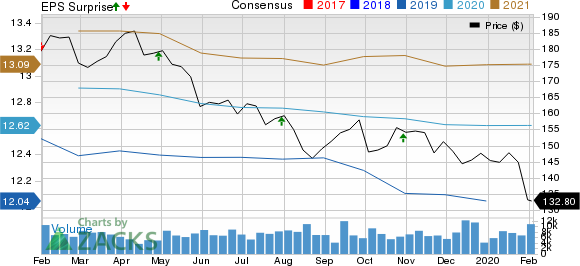
Simon Property Group, Inc. price-consensus-eps-surprise-chart | Simon Property Group, Inc. Quote
Currently, Simon Property carries a Zacks Rank #4 (Sell).
You can see the complete list of today’s Zacks #1 Rank (Strong Buy) stocks here.
We now look forward to the earnings releases of other REITs like SITE Centers Corp. SITC, Regency Centers Corporation REG and Healthpeak Properties, Inc. PEAK. While SITE Centers is slated to report quarterly numbers on Feb 13, Regency Centers and Healthpeak Properties will report fourth-quarter results on Feb 12 and Feb 11, respectively.
Note: Anything related to earnings presented in this write-up represents funds from operations (FFO) — a widely used metric to gauge the performance of REITs.
7 Best Stocks for the Next 30 Days
Just released: Experts distill 7 elite stocks from the current list of 220 Zacks Rank #1 Strong Buys. They deem these tickers “Most Likely for Early Price Pops.”
Since 1988, the full list has beaten the market more than 2X over with an average gain of +24.7% per year. So be sure to give these hand-picked 7 your immediate attention.
See 7 handpicked stocks now >>
Want the latest recommendations from Zacks Investment Research? Today, you can download 7 Best Stocks for the Next 30 Days. Click to get this free report
Simon Property Group, Inc. (SPG) : Free Stock Analysis Report
Regency Centers Corporation (REG) : Free Stock Analysis Report
SITE CENTERS CORP. (SITC) : Free Stock Analysis Report
Healthpeak Properties, Inc. (PEAK) : Free Stock Analysis Report
To read this article on Zacks.com click here.
Zacks Investment Research
