
 Yahoo Finance
 Is The Sherwin-Williams Company’s (NYSE:SHW) High P/E Ratio A Problem For Investors?

Want to participate in a short research study? Help shape the future of investing tools and you could win a $250 gift card!
This article is written for those who want to get better at using price to earnings ratios (P/E ratios). We’ll show how you can use The Sherwin-Williams Company’s (NYSE:SHW) P/E ratio to inform your assessment of the investment opportunity. Sherwin-Williams has a P/E ratio of 35.31, based on the last twelve months. That is equivalent to an earnings yield of about 2.8%.
See our latest analysis for Sherwin-Williams
How Do You Calculate Sherwin-Williams’s P/E Ratio?
The formula for P/E is:
Price to Earnings Ratio = Share Price ÷ Earnings per Share (EPS)
Or for Sherwin-Williams:
P/E of 35.31 = $421.01 ÷ $11.92 (Based on the year to December 2018.)
Is A High Price-to-Earnings Ratio Good?
A higher P/E ratio means that buyers have to pay a higher price for each $1 the company has earned over the last year. That isn’t necessarily good or bad, but a high P/E implies relatively high expectations of what a company can achieve in the future.
How Growth Rates Impact P/E Ratios
Earnings growth rates have a big influence on P/E ratios. Earnings growth means that in the future the ‘E’ will be higher. That means even if the current P/E is high, it will reduce over time if the share price stays flat. A lower P/E should indicate the stock is cheap relative to others — and that may attract buyers.
Sherwin-Williams’s earnings per share fell by 39% in the last twelve months. But over the longer term (5 years) earnings per share have increased by 18%.
How Does Sherwin-Williams’s P/E Ratio Compare To Its Peers?
The P/E ratio essentially measures market expectations of a company. The image below shows that Sherwin-Williams has a higher P/E than the average (19.3) P/E for companies in the chemicals industry.
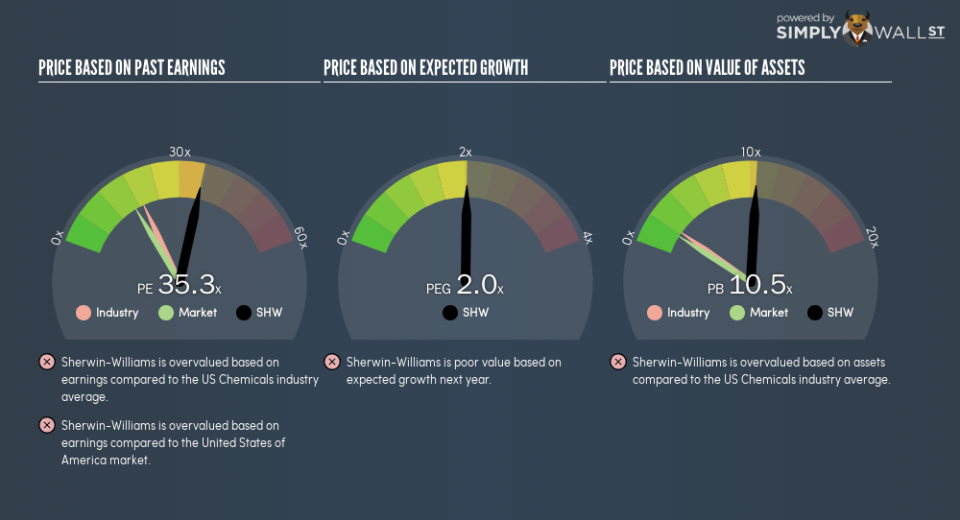
That means that the market expects Sherwin-Williams will outperform other companies in its industry. Clearly the market expects growth, but it isn’t guaranteed. So investors should delve deeper. I like to check if company insiders have been buying or selling.
Don’t Forget: The P/E Does Not Account For Debt or Bank Deposits
The ‘Price’ in P/E reflects the market capitalization of the company. That means it doesn’t take debt or cash into account. In theory, a company can lower its future P/E ratio by using cash or debt to invest in growth.
Such spending might be good or bad, overall, but the key point here is that you need to look at debt to understand the P/E ratio in context.
Is Debt Impacting Sherwin-Williams’s P/E?
Sherwin-Williams’s net debt is 23% of its market cap. That’s enough debt to impact the P/E ratio a little; so keep it in mind if you’re comparing it to companies without debt.
The Bottom Line On Sherwin-Williams’s P/E Ratio
Sherwin-Williams trades on a P/E ratio of 35.3, which is above the US market average of 16.8. With a bit of debt, but a lack of recent growth, it’s safe to say the market is expecting improved profit performance from the company, in the next few years.
When the market is wrong about a stock, it gives savvy investors an opportunity. People often underestimate remarkable growth — so investors can make money when fast growth is not fully appreciated. So this free report on the analyst consensus forecasts could help you make a master move on this stock.
Of course, you might find a fantastic investment by looking at a few good candidates. So take a peek at this free list of companies with modest (or no) debt, trading on a P/E below 20.
To help readers see past the short term volatility of the financial market, we aim to bring you a long-term focused research analysis purely driven by fundamental data. Note that our analysis does not factor in the latest price-sensitive company announcements.
The author is an independent contributor and at the time of publication had no position in the stocks mentioned. For errors that warrant correction please contact the editor at editorial-team@simplywallst.com.
