
 Yahoo Finance
 Shareholders in Universal Display (NASDAQ:OLED) are in the red if they invested three years ago
Universal Display Corporation (NASDAQ:OLED) shareholders should be happy to see the share price up 13% in the last month. But that cannot eclipse the less-than-impressive returns over the last three years. After all, the share price is down 44% in the last three years, significantly under-performing the market.
So let's have a look and see if the longer term performance of the company has been in line with the underlying business' progress.
See our latest analysis for Universal Display
There is no denying that markets are sometimes efficient, but prices do not always reflect underlying business performance. One imperfect but simple way to consider how the market perception of a company has shifted is to compare the change in the earnings per share (EPS) with the share price movement.
During the unfortunate three years of share price decline, Universal Display actually saw its earnings per share (EPS) improve by 13% per year. This is quite a puzzle, and suggests there might be something temporarily buoying the share price. Or else the company was over-hyped in the past, and so its growth has disappointed.
Since the change in EPS doesn't seem to correlate with the change in share price, it's worth taking a look at other metrics.
The modest 1.1% dividend yield is unlikely to be guiding the market view of the stock. Revenue is actually up 17% over the three years, so the share price drop doesn't seem to hinge on revenue, either. It's probably worth investigating Universal Display further; while we may be missing something on this analysis, there might also be an opportunity.
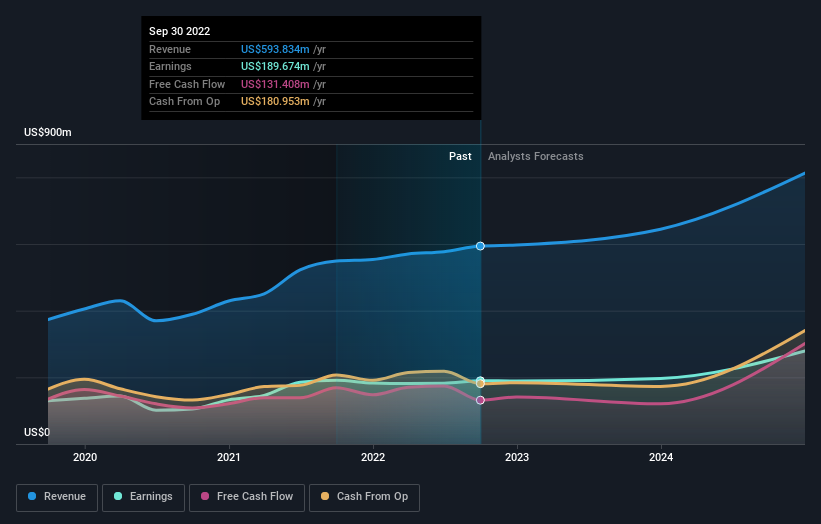
The company's revenue and earnings (over time) are depicted in the image below (click to see the exact numbers).
Universal Display is a well known stock, with plenty of analyst coverage, suggesting some visibility into future growth. You can see what analysts are predicting for Universal Display in this interactive graph of future profit estimates.
A Different Perspective
While the broader market lost about 19% in the twelve months, Universal Display shareholders did even worse, losing 25% (even including dividends). However, it could simply be that the share price has been impacted by broader market jitters. It might be worth keeping an eye on the fundamentals, in case there's a good opportunity. Regrettably, last year's performance caps off a bad run, with the shareholders facing a total loss of 7% per year over five years. We realise that Baron Rothschild has said investors should "buy when there is blood on the streets", but we caution that investors should first be sure they are buying a high quality business. While it is well worth considering the different impacts that market conditions can have on the share price, there are other factors that are even more important. Case in point: We've spotted 1 warning sign for Universal Display you should be aware of.
If you like to buy stocks alongside management, then you might just love this free list of companies. (Hint: insiders have been buying them).
Please note, the market returns quoted in this article reflect the market weighted average returns of stocks that currently trade on US exchanges.
Have feedback on this article? Concerned about the content? Get in touch with us directly. Alternatively, email editorial-team (at) simplywallst.com.
This article by Simply Wall St is general in nature. We provide commentary based on historical data and analyst forecasts only using an unbiased methodology and our articles are not intended to be financial advice. It does not constitute a recommendation to buy or sell any stock, and does not take account of your objectives, or your financial situation. We aim to bring you long-term focused analysis driven by fundamental data. Note that our analysis may not factor in the latest price-sensitive company announcements or qualitative material. Simply Wall St has no position in any stocks mentioned.
Join A Paid User Research Session
You’ll receive a US$30 Amazon Gift card for 1 hour of your time while helping us build better investing tools for the individual investors like yourself. Sign up here
