
 Yahoo Finance
 Shareholders in Mesoblast (ASX:MSB) are in the red if they invested a year ago
Investing in stocks comes with the risk that the share price will fall. And unfortunately for Mesoblast Limited (ASX:MSB) shareholders, the stock is a lot lower today than it was a year ago. The share price is down a hefty 63% in that time. The silver lining (for longer term investors) is that the stock is still 30% higher than it was three years ago.
Now let's have a look at the company's fundamentals, and see if the long term shareholder return has matched the performance of the underlying business.
View our latest analysis for Mesoblast
Because Mesoblast made a loss in the last twelve months, we think the market is probably more focussed on revenue and revenue growth, at least for now. When a company doesn't make profits, we'd generally expect to see good revenue growth. As you can imagine, fast revenue growth, when maintained, often leads to fast profit growth.
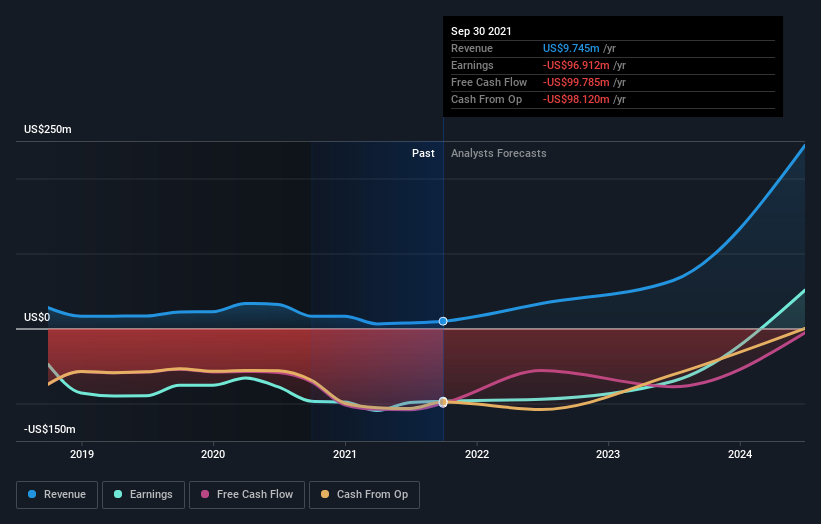
In just one year Mesoblast saw its revenue fall by 41%. That looks pretty grim, at a glance. The share price drop of 63% is understandable given the company doesn't have profits to boast of. Having said that, if growth is coming in the future, the stock may have better days ahead. We have a natural aversion to companies that are losing money and shrinking revenue. But perhaps that is being too careful.
The graphic below depicts how earnings and revenue have changed over time (unveil the exact values by clicking on the image).
This free interactive report on Mesoblast's balance sheet strength is a great place to start, if you want to investigate the stock further.
A Different Perspective
Mesoblast shareholders are down 63% for the year, but the market itself is up 15%. However, keep in mind that even the best stocks will sometimes underperform the market over a twelve month period. On the bright side, long term shareholders have made money, with a gain of 4% per year over half a decade. It could be that the recent sell-off is an opportunity, so it may be worth checking the fundamental data for signs of a long term growth trend. It's always interesting to track share price performance over the longer term. But to understand Mesoblast better, we need to consider many other factors. Case in point: We've spotted 2 warning signs for Mesoblast you should be aware of.
Of course Mesoblast may not be the best stock to buy. So you may wish to see this free collection of growth stocks.
Please note, the market returns quoted in this article reflect the market weighted average returns of stocks that currently trade on AU exchanges.
Have feedback on this article? Concerned about the content? Get in touch with us directly. Alternatively, email editorial-team (at) simplywallst.com.
This article by Simply Wall St is general in nature. We provide commentary based on historical data and analyst forecasts only using an unbiased methodology and our articles are not intended to be financial advice. It does not constitute a recommendation to buy or sell any stock, and does not take account of your objectives, or your financial situation. We aim to bring you long-term focused analysis driven by fundamental data. Note that our analysis may not factor in the latest price-sensitive company announcements or qualitative material. Simply Wall St has no position in any stocks mentioned.
