
 Yahoo Finance
 Shareholders Should Look Hard At Kelt Exploration Ltd.’s (TSE:KEL) 2.1% Return On Capital

Today we are going to look at Kelt Exploration Ltd. (TSE:KEL) to see whether it might be an attractive investment prospect. In particular, we'll consider its Return On Capital Employed (ROCE), as that can give us insight into how profitably the company is able to employ capital in its business.
First, we'll go over how we calculate ROCE. Second, we'll look at its ROCE compared to similar companies. And finally, we'll look at how its current liabilities are impacting its ROCE.
What is Return On Capital Employed (ROCE)?
ROCE is a metric for evaluating how much pre-tax income (in percentage terms) a company earns on the capital invested in its business. Generally speaking a higher ROCE is better. Overall, it is a valuable metric that has its flaws. Author Edwin Whiting says to be careful when comparing the ROCE of different businesses, since 'No two businesses are exactly alike.'
How Do You Calculate Return On Capital Employed?
Analysts use this formula to calculate return on capital employed:
Return on Capital Employed = Earnings Before Interest and Tax (EBIT) ÷ (Total Assets - Current Liabilities)
Or for Kelt Exploration:
0.021 = CA$32m ÷ (CA$1.6b - CA$103m) (Based on the trailing twelve months to June 2019.)
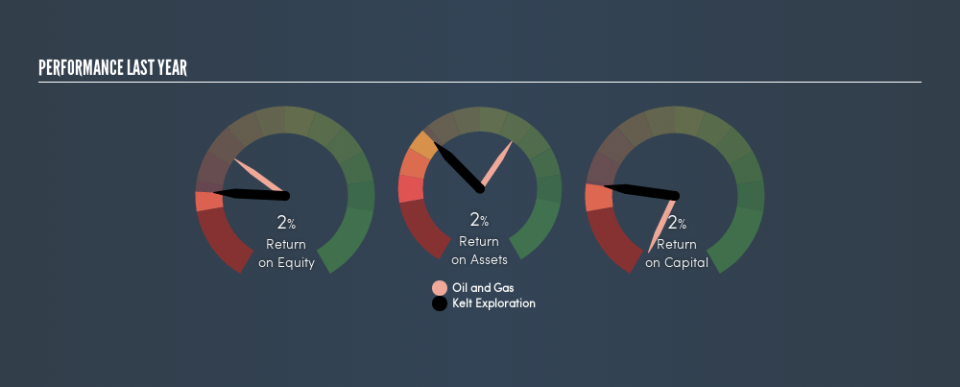
Therefore, Kelt Exploration has an ROCE of 2.1%.
Check out our latest analysis for Kelt Exploration
Does Kelt Exploration Have A Good ROCE?
ROCE can be useful when making comparisons, such as between similar companies. We can see Kelt Exploration's ROCE is meaningfully below the Oil and Gas industry average of 5.7%. This performance could be negative if sustained, as it suggests the business may underperform its industry. Independently of how Kelt Exploration compares to its industry, its ROCE in absolute terms is low; especially compared to the ~1.9% available in government bonds. There are potentially more appealing investments elsewhere.
Kelt Exploration delivered an ROCE of 2.1%, which is better than 3 years ago, as was making losses back then. This makes us wonder if the company is improving. The image below shows how Kelt Exploration's ROCE compares to its industry, and you can click it to see more detail on its past growth.
It is important to remember that ROCE shows past performance, and is not necessarily predictive. ROCE can be misleading for companies in cyclical industries, with returns looking impressive during the boom times, but very weak during the busts. ROCE is, after all, simply a snap shot of a single year. Given the industry it operates in, Kelt Exploration could be considered cyclical. What happens in the future is pretty important for investors, so we have prepared a free report on analyst forecasts for Kelt Exploration.
Kelt Exploration's Current Liabilities And Their Impact On Its ROCE
Short term (or current) liabilities, are things like supplier invoices, overdrafts, or tax bills that need to be paid within 12 months. Due to the way ROCE is calculated, a high level of current liabilities makes a company look as though it has less capital employed, and thus can (sometimes unfairly) boost the ROCE. To counter this, investors can check if a company has high current liabilities relative to total assets.
Kelt Exploration has total assets of CA$1.6b and current liabilities of CA$103m. As a result, its current liabilities are equal to approximately 6.5% of its total assets. Kelt Exploration has very few current liabilities, which have a minimal effect on its already low ROCE.
Our Take On Kelt Exploration's ROCE
Still, investors could probably find more attractive prospects with better performance out there. You might be able to find a better investment than Kelt Exploration. If you want a selection of possible winners, check out this free list of interesting companies that trade on a P/E below 20 (but have proven they can grow earnings).
For those who like to find winning investments this free list of growing companies with recent insider purchasing, could be just the ticket.
We aim to bring you long-term focused research analysis driven by fundamental data. Note that our analysis may not factor in the latest price-sensitive company announcements or qualitative material.
If you spot an error that warrants correction, please contact the editor at editorial-team@simplywallst.com. This article by Simply Wall St is general in nature. It does not constitute a recommendation to buy or sell any stock, and does not take account of your objectives, or your financial situation. Simply Wall St has no position in the stocks mentioned. Thank you for reading.
