
 Yahoo Finance
 Shareholders Of Greggs (LON:GRG) Must Be Happy With Their 145% Total Return
When you buy shares in a company, it's worth keeping in mind the possibility that it could fail, and you could lose your money. But on the bright side, you can make far more than 100% on a really good stock. For example, the Greggs plc (LON:GRG) share price has soared 122% in the last half decade. Most would be very happy with that. On top of that, the share price is up 21% in about a quarter. This could be related to the recent financial results, released recently - you can catch up on the most recent data by reading our company report.
View our latest analysis for Greggs
To paraphrase Benjamin Graham: Over the short term the market is a voting machine, but over the long term it's a weighing machine. One way to examine how market sentiment has changed over time is to look at the interaction between a company's share price and its earnings per share (EPS).
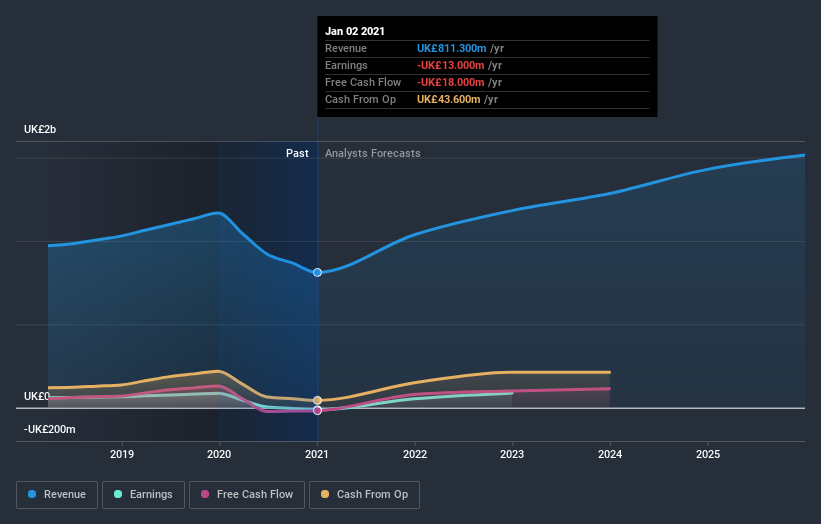
During five years of share price growth, Greggs actually saw its EPS drop 13% per year.
This means it's unlikely the market is judging the company based on earnings growth. Because earnings per share don't seem to match up with the share price, we'll take a look at other metrics instead.
In contrast revenue growth of 3.0% per year is probably viewed as evidence that Greggs is growing, a real positive. It's quite possible that management are prioritizing revenue growth over EPS growth at the moment.
You can see below how earnings and revenue have changed over time (discover the exact values by clicking on the image).
If you are thinking of buying or selling Greggs stock, you should check out this FREE detailed report on its balance sheet.
What about the Total Shareholder Return (TSR)?
We've already covered Greggs' share price action, but we should also mention its total shareholder return (TSR). Arguably the TSR is a more complete return calculation because it accounts for the value of dividends (as if they were reinvested), along with the hypothetical value of any discounted capital that have been offered to shareholders. Dividends have been really beneficial for Greggs shareholders, and that cash payout contributed to why its TSR of 145%, over the last 5 years, is better than the share price return.
A Different Perspective
Greggs' TSR for the year was broadly in line with the market average, at 32%. Most would be happy with a gain, and it helps that the year's return is actually better than the average return over five years, which was 20%. It is possible that management foresight will bring growth well into the future, even if the share price slows down. It's always interesting to track share price performance over the longer term. But to understand Greggs better, we need to consider many other factors. For example, we've discovered 1 warning sign for Greggs that you should be aware of before investing here.
If you would prefer to check out another company -- one with potentially superior financials -- then do not miss this free list of companies that have proven they can grow earnings.
Please note, the market returns quoted in this article reflect the market weighted average returns of stocks that currently trade on GB exchanges.
This article by Simply Wall St is general in nature. It does not constitute a recommendation to buy or sell any stock, and does not take account of your objectives, or your financial situation. We aim to bring you long-term focused analysis driven by fundamental data. Note that our analysis may not factor in the latest price-sensitive company announcements or qualitative material. Simply Wall St has no position in any stocks mentioned.
Have feedback on this article? Concerned about the content? Get in touch with us directly. Alternatively, email editorial-team (at) simplywallst.com.
