
 Yahoo Finance
 Shareholders in Campbell Soup (NYSE:CPB) are in the red if they invested five years ago
The main aim of stock picking is to find the market-beating stocks. But every investor is virtually certain to have both over-performing and under-performing stocks. So we wouldn't blame long term Campbell Soup Company (NYSE:CPB) shareholders for doubting their decision to hold, with the stock down 21% over a half decade.
With that in mind, it's worth seeing if the company's underlying fundamentals have been the driver of long term performance, or if there are some discrepancies.
See our latest analysis for Campbell Soup
While markets are a powerful pricing mechanism, share prices reflect investor sentiment, not just underlying business performance. One flawed but reasonable way to assess how sentiment around a company has changed is to compare the earnings per share (EPS) with the share price.
During the unfortunate half decade during which the share price slipped, Campbell Soup actually saw its earnings per share (EPS) improve by 13% per year. So it doesn't seem like EPS is a great guide to understanding how the market is valuing the stock. Or possibly, the market was previously very optimistic, so the stock has disappointed, despite improving EPS.
Generally speaking we'd expect to see stronger share price increases on the back of sustained EPS growth, but other metrics may hold a clue to why the share price performance is relatively modest.
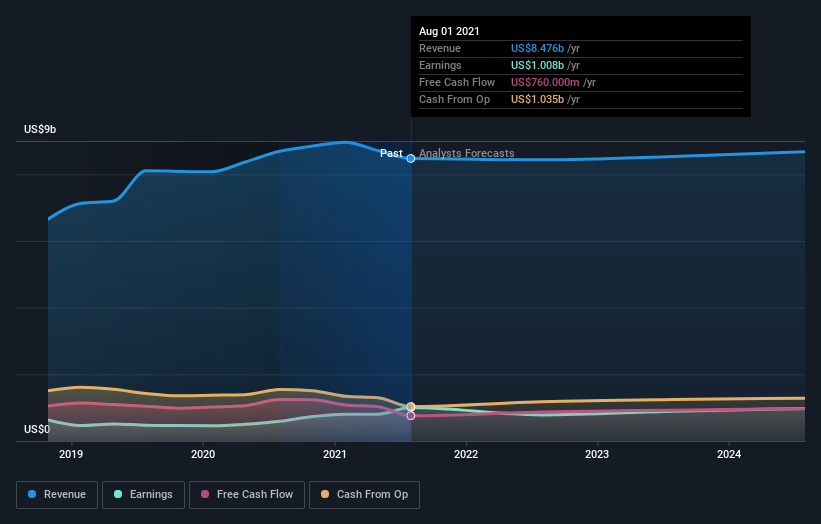
Revenue is actually up 3.6% over the time period. A more detailed examination of the revenue and earnings may or may not explain why the share price languishes; there could be an opportunity.
The graphic below depicts how earnings and revenue have changed over time (unveil the exact values by clicking on the image).
Campbell Soup is well known by investors, and plenty of clever analysts have tried to predict the future profit levels. If you are thinking of buying or selling Campbell Soup stock, you should check out this free report showing analyst consensus estimates for future profits.
What About Dividends?
When looking at investment returns, it is important to consider the difference between total shareholder return (TSR) and share price return. The TSR is a return calculation that accounts for the value of cash dividends (assuming that any dividend received was reinvested) and the calculated value of any discounted capital raisings and spin-offs. Arguably, the TSR gives a more comprehensive picture of the return generated by a stock. As it happens, Campbell Soup's TSR for the last 5 years was -7.6%, which exceeds the share price return mentioned earlier. And there's no prize for guessing that the dividend payments largely explain the divergence!
A Different Perspective
While the broader market gained around 35% in the last year, Campbell Soup shareholders lost 1.4% (even including dividends). However, keep in mind that even the best stocks will sometimes underperform the market over a twelve month period. However, the loss over the last year isn't as bad as the 1.5% per annum loss investors have suffered over the last half decade. We'd need to see some sustained improvements in the key metrics before we could muster much enthusiasm. It's always interesting to track share price performance over the longer term. But to understand Campbell Soup better, we need to consider many other factors. For instance, we've identified 1 warning sign for Campbell Soup that you should be aware of.
If you are like me, then you will not want to miss this free list of growing companies that insiders are buying.
Please note, the market returns quoted in this article reflect the market weighted average returns of stocks that currently trade on US exchanges.
This article by Simply Wall St is general in nature. We provide commentary based on historical data and analyst forecasts only using an unbiased methodology and our articles are not intended to be financial advice. It does not constitute a recommendation to buy or sell any stock, and does not take account of your objectives, or your financial situation. We aim to bring you long-term focused analysis driven by fundamental data. Note that our analysis may not factor in the latest price-sensitive company announcements or qualitative material. Simply Wall St has no position in any stocks mentioned.
Have feedback on this article? Concerned about the content? Get in touch with us directly. Alternatively, email editorial-team (at) simplywallst.com.
