
 Yahoo Finance
 Shareholders in Camden National (NASDAQ:CAC) are in the red if they invested a year ago
Most people feel a little frustrated if a stock they own goes down in price. But in the short term the market is a voting machine, and the share price movements may not reflect the underlying business performance. The Camden National Corporation (NASDAQ:CAC) is down 12% over a year, but the total shareholder return is -8.8% once you include the dividend. And that total return actually beats the market decline of 9.0%. At least the damage isn't so bad if you look at the last three years, since the stock is down 3.3% in that time. In the last ninety days we've seen the share price slide 13%. However, one could argue that the price has been influenced by the general market, which is down 11% in the same timeframe.
With that in mind, it's worth seeing if the company's underlying fundamentals have been the driver of long term performance, or if there are some discrepancies.
See our latest analysis for Camden National
There is no denying that markets are sometimes efficient, but prices do not always reflect underlying business performance. One imperfect but simple way to consider how the market perception of a company has shifted is to compare the change in the earnings per share (EPS) with the share price movement.
During the unfortunate twelve months during which the Camden National share price fell, it actually saw its earnings per share (EPS) improve by 1.0%. Of course, the situation might betray previous over-optimism about growth.
By glancing at these numbers, we'd posit that the the market had expectations of much higher growth, last year. But looking to other metrics might better explain the share price change.
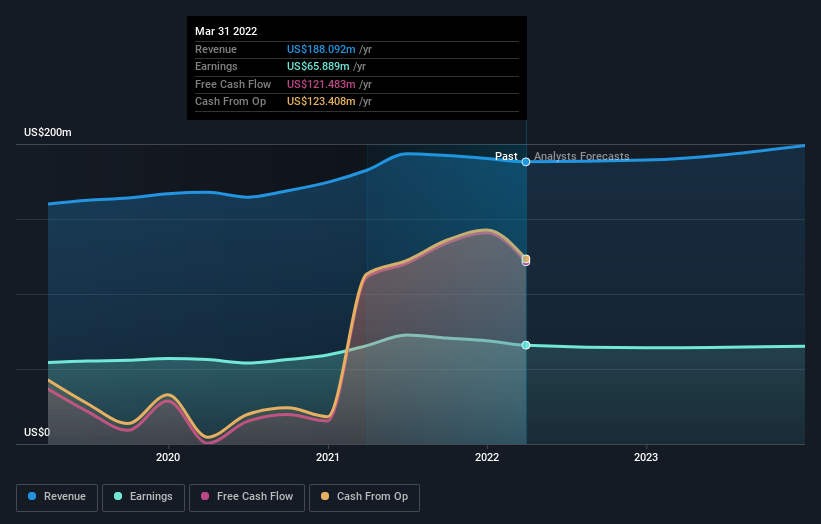
Camden National's revenue is actually up 3.1% over the last year. Since we can't easily explain the share price movement based on these metrics, it might be worth considering how market sentiment has changed towards the stock.
The image below shows how earnings and revenue have tracked over time (if you click on the image you can see greater detail).
It's probably worth noting we've seen significant insider buying in the last quarter, which we consider a positive. On the other hand, we think the revenue and earnings trends are much more meaningful measures of the business. So we recommend checking out this free report showing consensus forecasts
What About Dividends?
As well as measuring the share price return, investors should also consider the total shareholder return (TSR). The TSR is a return calculation that accounts for the value of cash dividends (assuming that any dividend received was reinvested) and the calculated value of any discounted capital raisings and spin-offs. So for companies that pay a generous dividend, the TSR is often a lot higher than the share price return. In the case of Camden National, it has a TSR of -8.8% for the last 1 year. That exceeds its share price return that we previously mentioned. And there's no prize for guessing that the dividend payments largely explain the divergence!
A Different Perspective
Camden National shareholders are down 8.8% over twelve months (even including dividends), which isn't far from the market return of -9.0%. The silver lining is that longer term investors would have made a total return of 4% per year over half a decade. If the fundamental data remains strong, and the share price is simply down on sentiment, then this could be an opportunity worth investigating. If you want to research this stock further, the data on insider buying is an obvious place to start. You can click here to see who has been buying shares - and the price they paid.
Camden National is not the only stock that insiders are buying. For those who like to find winning investments this free list of growing companies with recent insider purchasing, could be just the ticket.
Please note, the market returns quoted in this article reflect the market weighted average returns of stocks that currently trade on US exchanges.
Have feedback on this article? Concerned about the content? Get in touch with us directly. Alternatively, email editorial-team (at) simplywallst.com.
This article by Simply Wall St is general in nature. We provide commentary based on historical data and analyst forecasts only using an unbiased methodology and our articles are not intended to be financial advice. It does not constitute a recommendation to buy or sell any stock, and does not take account of your objectives, or your financial situation. We aim to bring you long-term focused analysis driven by fundamental data. Note that our analysis may not factor in the latest price-sensitive company announcements or qualitative material. Simply Wall St has no position in any stocks mentioned.
