
 Yahoo Finance
 Seven Generations Energy Ltd. (TSE:VII) Earns Among The Best Returns In Its Industry

Today we’ll look at Seven Generations Energy Ltd. (TSE:VII) and reflect on its potential as an investment. In particular, we’ll consider its Return On Capital Employed (ROCE), as that can give us insight into how profitably the company is able to employ capital in its business.
First of all, we’ll work out how to calculate ROCE. Next, we’ll compare it to others in its industry. Finally, we’ll look at how its current liabilities affect its ROCE.
What is Return On Capital Employed (ROCE)?
ROCE measures the amount of pre-tax profits a company can generate from the capital employed in its business. In general, businesses with a higher ROCE are usually better quality. Overall, it is a valuable metric that has its flaws. Author Edwin Whiting says to be careful when comparing the ROCE of different businesses, since ‘No two businesses are exactly alike.’
How Do You Calculate Return On Capital Employed?
Analysts use this formula to calculate return on capital employed:
Return on Capital Employed = Earnings Before Interest and Tax (EBIT) ÷ (Total Assets – Current Liabilities)
Or for Seven Generations Energy:
0.083 = CA$816m ÷ (CA$8.1b – CA$629m) (Based on the trailing twelve months to September 2018.)
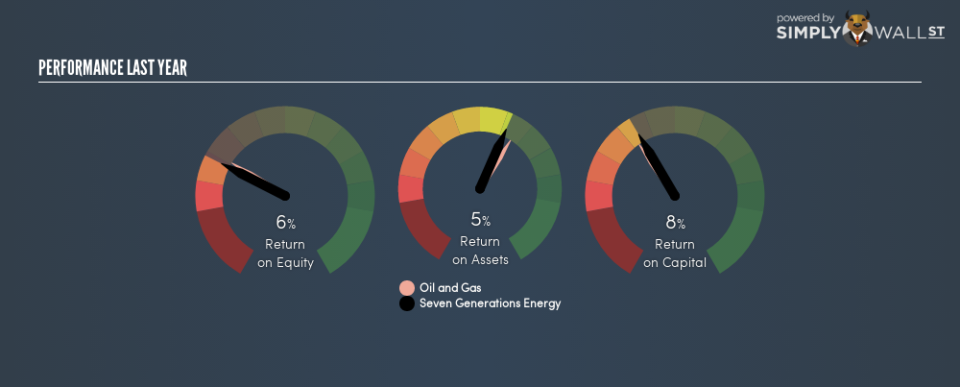
Therefore, Seven Generations Energy has an ROCE of 8.3%.
Check out our latest analysis for Seven Generations Energy
Is Seven Generations Energy’s ROCE Good?
ROCE is commonly used for comparing the performance of similar businesses. Seven Generations Energy’s ROCE appears to be substantially greater than the 4.8% average in the Oil and Gas industry. We would consider this a positive, as it suggests it is using capital more effectively than other similar companies. Setting aside the industry comparison for now, Seven Generations Energy’s ROCE is mediocre in absolute terms, considering the risk of investing in stocks versus the safety of a bank account. Readers may find more attractive investment prospects elsewhere.
It is important to remember that ROCE shows past performance, and is not necessarily predictive. ROCE can be deceptive for cyclical businesses, as returns can look incredible in boom times, and terribly low in downturns. This is because ROCE only looks at one year, instead of considering returns across a whole cycle. Remember that most companies like Seven Generations Energy are cyclical businesses. Since the future is so important for investors, you should check out our free report on analyst forecasts for Seven Generations Energy.
How Seven Generations Energy’s Current Liabilities Impact Its ROCE
Liabilities, such as supplier bills and bank overdrafts, are referred to as current liabilities if they need to be paid within 12 months. The ROCE equation subtracts current liabilities from capital employed, so a company with a lot of current liabilities appears to have less capital employed, and a higher ROCE than otherwise. To check the impact of this, we calculate if a company has high current liabilities relative to its total assets.
Seven Generations Energy has total assets of CA$8.1b and current liabilities of CA$629m. Therefore its current liabilities are equivalent to approximately 7.8% of its total assets. Seven Generations Energy reports few current liabilities, which have a negligible impact on its unremarkable ROCE.
What We Can Learn From Seven Generations Energy’s ROCE
Based on this information, Seven Generations Energy appears to be a mediocre business. You might be able to find a better buy than Seven Generations Energy. If you want a selection of possible winners, check out this free list of interesting companies that trade on a P/E below 20 (but have proven they can grow earnings).
If you are like me, then you will not want to miss this free list of growing companies that insiders are buying.
To help readers see past the short term volatility of the financial market, we aim to bring you a long-term focused research analysis purely driven by fundamental data. Note that our analysis does not factor in the latest price-sensitive company announcements.
The author is an independent contributor and at the time of publication had no position in the stocks mentioned. For errors that warrant correction please contact the editor at editorial-team@simplywallst.com.
