
 Yahoo Finance
 Should Sempra Energy (NYSE:SRE) Be Disappointed With Their 10% Profit?
It hasn't been the best quarter for Sempra Energy (NYSE:SRE) shareholders, since the share price has fallen 20% in that time. In contrast the stock is up over the last three years. However, it's unlikely many shareholders are elated with the share price gain of 10% over that time, given the rising market.
Check out our latest analysis for Sempra Energy
While markets are a powerful pricing mechanism, share prices reflect investor sentiment, not just underlying business performance. One imperfect but simple way to consider how the market perception of a company has shifted is to compare the change in the earnings per share (EPS) with the share price movement.
Sempra Energy was able to grow its EPS at 3.6% per year over three years, sending the share price higher. We don't think it is entirely coincidental that the EPS growth is reasonably close to the 3.3% average annual increase in the share price. This observation indicates that the market's attitude to the business hasn't changed all that much. Au contraire, the share price change has arguably mimicked the EPS growth.
The image below shows how EPS has tracked over time (if you click on the image you can see greater detail).
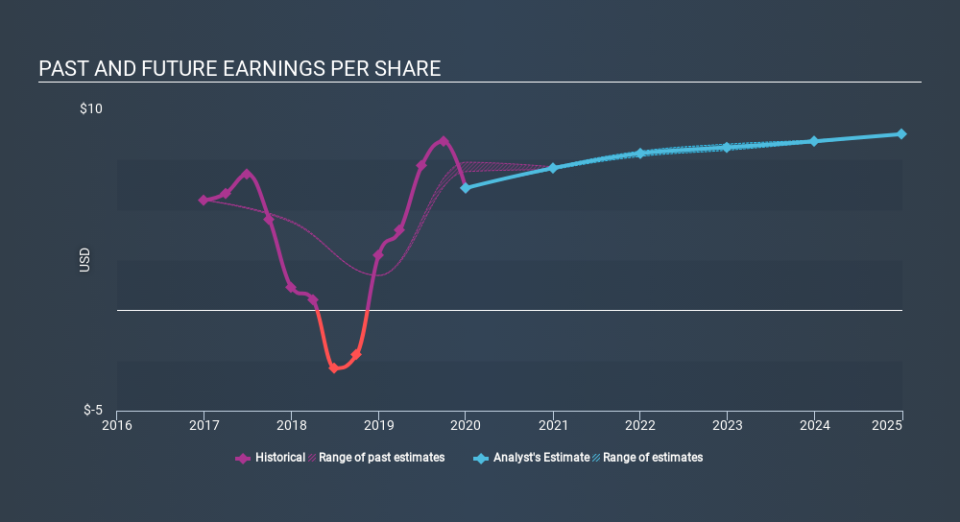
It's good to see that there was some significant insider buying in the last three months. That's a positive. That said, we think earnings and revenue growth trends are even more important factors to consider. Dive deeper into the earnings by checking this interactive graph of Sempra Energy's earnings, revenue and cash flow.
What About Dividends?
It is important to consider the total shareholder return, as well as the share price return, for any given stock. The TSR incorporates the value of any spin-offs or discounted capital raisings, along with any dividends, based on the assumption that the dividends are reinvested. It's fair to say that the TSR gives a more complete picture for stocks that pay a dividend. As it happens, Sempra Energy's TSR for the last 3 years was 21%, which exceeds the share price return mentioned earlier. This is largely a result of its dividend payments!
A Different Perspective
While it's certainly disappointing to see that Sempra Energy shares lost 1.4% throughout the year, that wasn't as bad as the market loss of 11%. Of course, the long term returns are far more important and the good news is that over five years, the stock has returned 5.0% for each year. It could be that the business is just facing some short term problems, but shareholders should keep a close eye on the fundamentals. I find it very interesting to look at share price over the long term as a proxy for business performance. But to truly gain insight, we need to consider other information, too. To that end, you should learn about the 3 warning signs we've spotted with Sempra Energy (including 1 which is makes us a bit uncomfortable) .
There are plenty of other companies that have insiders buying up shares. You probably do not want to miss this free list of growing companies that insiders are buying.
Please note, the market returns quoted in this article reflect the market weighted average returns of stocks that currently trade on US exchanges.
If you spot an error that warrants correction, please contact the editor at editorial-team@simplywallst.com. This article by Simply Wall St is general in nature. It does not constitute a recommendation to buy or sell any stock, and does not take account of your objectives, or your financial situation. Simply Wall St has no position in the stocks mentioned.
We aim to bring you long-term focused research analysis driven by fundamental data. Note that our analysis may not factor in the latest price-sensitive company announcements or qualitative material. Thank you for reading.
