
 Yahoo Finance
 Semler Scientific (NASDAQ:SMLR) surges 10% this week, taking five-year gains to 512%
Long term investing can be life changing when you buy and hold the truly great businesses. While the best companies are hard to find, but they can generate massive returns over long periods. Just think about the savvy investors who held Semler Scientific, Inc. (NASDAQ:SMLR) shares for the last five years, while they gained 512%. This just goes to show the value creation that some businesses can achieve. It's also good to see the share price up 38% over the last quarter. Anyone who held for that rewarding ride would probably be keen to talk about it.
Since it's been a strong week for Semler Scientific shareholders, let's have a look at trend of the longer term fundamentals.
Check out our latest analysis for Semler Scientific
While markets are a powerful pricing mechanism, share prices reflect investor sentiment, not just underlying business performance. By comparing earnings per share (EPS) and share price changes over time, we can get a feel for how investor attitudes to a company have morphed over time.
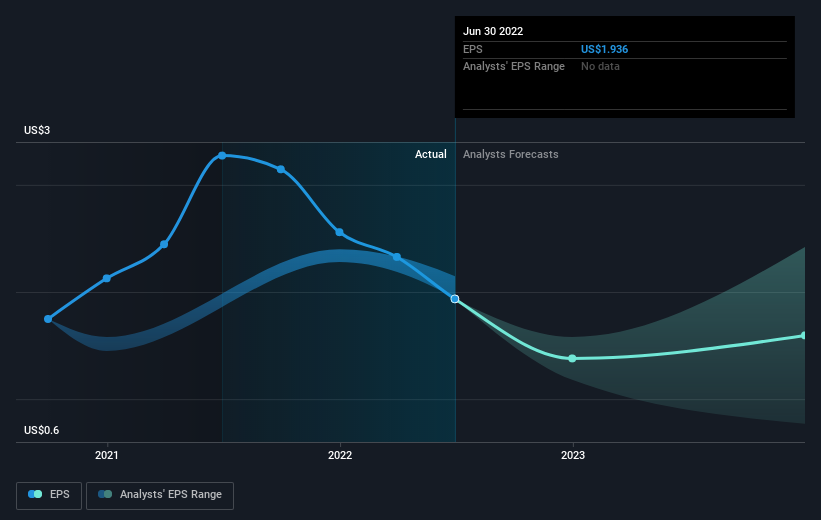
During the last half decade, Semler Scientific became profitable. Sometimes, the start of profitability is a major inflection point that can signal fast earnings growth to come, which in turn justifies very strong share price gains. Since the company was unprofitable five years ago, but not three years ago, it's worth taking a look at the returns in the last three years, too. In fact, the Semler Scientific stock price is 8.7% lower in the last three years. In the same period, EPS is up 18% per year. It would appear there's a real mismatch between the increasing EPS and the share price, which has declined -3.0% a year for three years.
The image below shows how EPS has tracked over time (if you click on the image you can see greater detail).
It's probably worth noting that the CEO is paid less than the median at similar sized companies. It's always worth keeping an eye on CEO pay, but a more important question is whether the company will grow earnings throughout the years. It might be well worthwhile taking a look at our free report on Semler Scientific's earnings, revenue and cash flow.
A Different Perspective
We regret to report that Semler Scientific shareholders are down 71% for the year. Unfortunately, that's worse than the broader market decline of 21%. However, it could simply be that the share price has been impacted by broader market jitters. It might be worth keeping an eye on the fundamentals, in case there's a good opportunity. On the bright side, long term shareholders have made money, with a gain of 44% per year over half a decade. If the fundamental data continues to indicate long term sustainable growth, the current sell-off could be an opportunity worth considering. I find it very interesting to look at share price over the long term as a proxy for business performance. But to truly gain insight, we need to consider other information, too. For instance, we've identified 1 warning sign for Semler Scientific that you should be aware of.
If you like to buy stocks alongside management, then you might just love this free list of companies. (Hint: insiders have been buying them).
Please note, the market returns quoted in this article reflect the market weighted average returns of stocks that currently trade on US exchanges.
Have feedback on this article? Concerned about the content? Get in touch with us directly. Alternatively, email editorial-team (at) simplywallst.com.
This article by Simply Wall St is general in nature. We provide commentary based on historical data and analyst forecasts only using an unbiased methodology and our articles are not intended to be financial advice. It does not constitute a recommendation to buy or sell any stock, and does not take account of your objectives, or your financial situation. We aim to bring you long-term focused analysis driven by fundamental data. Note that our analysis may not factor in the latest price-sensitive company announcements or qualitative material. Simply Wall St has no position in any stocks mentioned.
Join A Paid User Research Session
You’ll receive a US$30 Amazon Gift card for 1 hour of your time while helping us build better investing tools for the individual investors like yourself. Sign up here
