
 Yahoo Finance
 Can We See Significant Institutional Ownership On The New Gold Inc. (TSE:NGD) Share Register?

Every investor in New Gold Inc. (TSE:NGD) should be aware of the most powerful shareholder groups. Insiders often own a large chunk of younger, smaller, companies while huge companies tend to have institutions as shareholders. We also tend to see lower insider ownership in companies that were previously publicly owned.
New Gold is not a large company by global standards. It has a market capitalization of CA$881m, which means it wouldn't have the attention of many institutional investors. Taking a look at our data on the ownership groups (below), it's seems that institutions own shares in the company. We can zoom in on the different ownership groups, to learn more about NGD.
See our latest analysis for New Gold
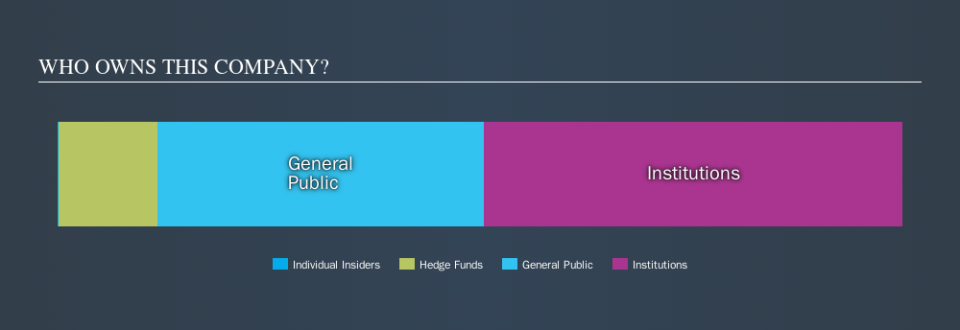
What Does The Institutional Ownership Tell Us About New Gold?
Many institutions measure their performance against an index that approximates the local market. So they usually pay more attention to companies that are included in major indices.
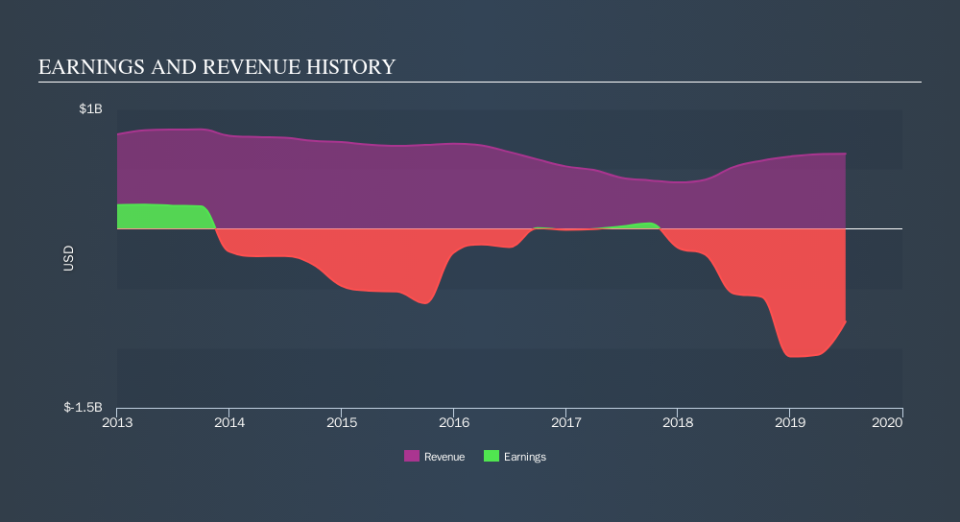
We can see that New Gold does have institutional investors; and they hold 49% of the stock. This suggests some credibility amongst professional investors. But we can't rely on that fact alone, since institutions make bad investments sometimes, just like everyone does. If multiple institutions change their view on a stock at the same time, you could see the share price drop fast. It's therefore worth looking at New Gold's earnings history, below. Of course, the future is what really matters.
Our data indicates that hedge funds own 12% of New Gold. That catches my attention because hedge funds sometimes try to influence management, or bring about changes that will create near term value for shareholders. There are a reasonable number of analysts covering the stock, so it might be useful to find out their aggregate view on the future.
Insider Ownership Of New Gold
While the precise definition of an insider can be subjective, almost everyone considers board members to be insiders. Management ultimately answers to the board. However, it is not uncommon for managers to be executive board members, especially if they are a founder or the CEO.
I generally consider insider ownership to be a good thing. However, on some occasions it makes it more difficult for other shareholders to hold the board accountable for decisions.
Our information suggests that New Gold Inc. insiders own under 1% of the company. It has a market capitalization of just CA$881m, and the board has only CA$1.9m worth of shares in their own names. I generally like to see a board more invested. However it might be worth checking if those insiders have been buying.
General Public Ownership
The general public holds a 39% stake in NGD. While this group can't necessarily call the shots, it can certainly have a real influence on how the company is run.
Next Steps:
While it is well worth considering the different groups that own a company, there are other factors that are even more important.
I like to dive deeper into how a company has performed in the past. You can access this interactive graph of past earnings, revenue and cash flow, for free.
Ultimately the future is most important. You can access this free report on analyst forecasts for the company.
NB: Figures in this article are calculated using data from the last twelve months, which refer to the 12-month period ending on the last date of the month the financial statement is dated. This may not be consistent with full year annual report figures.
We aim to bring you long-term focused research analysis driven by fundamental data. Note that our analysis may not factor in the latest price-sensitive company announcements or qualitative material.
If you spot an error that warrants correction, please contact the editor at editorial-team@simplywallst.com. This article by Simply Wall St is general in nature. It does not constitute a recommendation to buy or sell any stock, and does not take account of your objectives, or your financial situation. Simply Wall St has no position in the stocks mentioned. Thank you for reading.
