
 Yahoo Finance
 How Do Secure Energy Services Inc.’s (TSE:SES) Returns Compare To Its Industry?

Today we are going to look at Secure Energy Services Inc. (TSE:SES) to see whether it might be an attractive investment prospect. Specifically, we're going to calculate its Return On Capital Employed (ROCE), in the hopes of getting some insight into the business.
First, we'll go over how we calculate ROCE. Then we'll compare its ROCE to similar companies. Last but not least, we'll look at what impact its current liabilities have on its ROCE.
Return On Capital Employed (ROCE): What is it?
ROCE is a measure of a company's yearly pre-tax profit (its return), relative to the capital employed in the business. In general, businesses with a higher ROCE are usually better quality. In brief, it is a useful tool, but it is not without drawbacks. Author Edwin Whiting says to be careful when comparing the ROCE of different businesses, since 'No two businesses are exactly alike.'
How Do You Calculate Return On Capital Employed?
The formula for calculating the return on capital employed is:
Return on Capital Employed = Earnings Before Interest and Tax (EBIT) ÷ (Total Assets - Current Liabilities)
Or for Secure Energy Services:
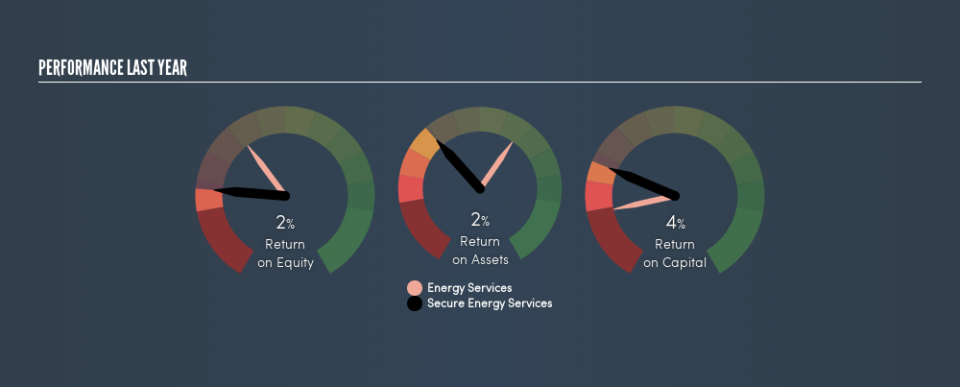
0.04 = CA$56m ÷ (CA$1.6b - CA$178m) (Based on the trailing twelve months to December 2018.)
So, Secure Energy Services has an ROCE of 4.0%.
See our latest analysis for Secure Energy Services
Is Secure Energy Services's ROCE Good?
ROCE is commonly used for comparing the performance of similar businesses. In this analysis, Secure Energy Services's ROCE appears meaningfully below the 6.8% average reported by the Energy Services industry. This performance is not ideal, as it suggests the company may not be deploying its capital as effectively as some competitors. Regardless of how Secure Energy Services stacks up against its industry, its ROCE in absolute terms is quite low (especially compared to a bank account). Readers may wish to look for more rewarding investments.
Secure Energy Services has an ROCE of 4.0%, but it didn't have an ROCE 3 years ago, since it was unprofitable. That suggests the business has returned to profitability.
When considering ROCE, bear in mind that it reflects the past and does not necessarily predict the future. ROCE can be misleading for companies in cyclical industries, with returns looking impressive during the boom times, but very weak during the busts. ROCE is only a point-in-time measure. Given the industry it operates in, Secure Energy Services could be considered cyclical. Since the future is so important for investors, you should check out our free report on analyst forecasts for Secure Energy Services.
Secure Energy Services's Current Liabilities And Their Impact On Its ROCE
Short term (or current) liabilities, are things like supplier invoices, overdrafts, or tax bills that need to be paid within 12 months. The ROCE equation subtracts current liabilities from capital employed, so a company with a lot of current liabilities appears to have less capital employed, and a higher ROCE than otherwise. To counter this, investors can check if a company has high current liabilities relative to total assets.
Secure Energy Services has total liabilities of CA$178m and total assets of CA$1.6b. Therefore its current liabilities are equivalent to approximately 11% of its total assets. With a very reasonable level of current liabilities, so the impact on ROCE is fairly minimal.
Our Take On Secure Energy Services's ROCE
Secure Energy Services has a poor ROCE, and there may be better investment prospects out there. Of course, you might find a fantastic investment by looking at a few good candidates. So take a peek at this free list of companies with modest (or no) debt, trading on a P/E below 20.
For those who like to find winning investments this free list of growing companies with recent insider purchasing, could be just the ticket.
We aim to bring you long-term focused research analysis driven by fundamental data. Note that our analysis may not factor in the latest price-sensitive company announcements or qualitative material.
If you spot an error that warrants correction, please contact the editor at editorial-team@simplywallst.com. This article by Simply Wall St is general in nature. It does not constitute a recommendation to buy or sell any stock, and does not take account of your objectives, or your financial situation. Simply Wall St has no position in the stocks mentioned. Thank you for reading.
