
 Yahoo Finance
 Is Secure Energy Services Inc. (TSE:SES) Investing Your Capital Efficiently?

Today we are going to look at Secure Energy Services Inc. (TSE:SES) to see whether it might be an attractive investment prospect. Specifically, we'll consider its Return On Capital Employed (ROCE), since that will give us an insight into how efficiently the business can generate profits from the capital it requires.
First up, we'll look at what ROCE is and how we calculate it. Next, we'll compare it to others in its industry. Last but not least, we'll look at what impact its current liabilities have on its ROCE.
What is Return On Capital Employed (ROCE)?
ROCE is a measure of a company's yearly pre-tax profit (its return), relative to the capital employed in the business. In general, businesses with a higher ROCE are usually better quality. Overall, it is a valuable metric that has its flaws. Author Edwin Whiting says to be careful when comparing the ROCE of different businesses, since 'No two businesses are exactly alike.
So, How Do We Calculate ROCE?
Analysts use this formula to calculate return on capital employed:
Return on Capital Employed = Earnings Before Interest and Tax (EBIT) ÷ (Total Assets - Current Liabilities)
Or for Secure Energy Services:
0.03 = CA$43m ÷ (CA$1.6b - CA$174m) (Based on the trailing twelve months to September 2019.)
Therefore, Secure Energy Services has an ROCE of 3.0%.
See our latest analysis for Secure Energy Services
Is Secure Energy Services's ROCE Good?
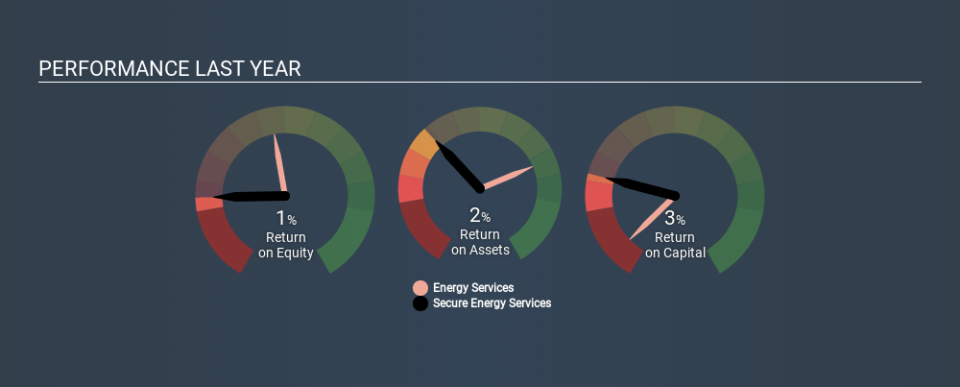
When making comparisons between similar businesses, investors may find ROCE useful. We can see Secure Energy Services's ROCE is meaningfully below the Energy Services industry average of 7.6%. This performance could be negative if sustained, as it suggests the business may underperform its industry. Putting aside Secure Energy Services's performance relative to its industry, its ROCE in absolute terms is poor - considering the risk of owning stocks compared to government bonds. There are potentially more appealing investments elsewhere.
Secure Energy Services delivered an ROCE of 3.0%, which is better than 3 years ago, as was making losses back then. This makes us wonder if the company is improving. You can see in the image below how Secure Energy Services's ROCE compares to its industry. Click to see more on past growth.
Remember that this metric is backwards looking - it shows what has happened in the past, and does not accurately predict the future. ROCE can be misleading for companies in cyclical industries, with returns looking impressive during the boom times, but very weak during the busts. ROCE is, after all, simply a snap shot of a single year. We note Secure Energy Services could be considered a cyclical business. Future performance is what matters, and you can see analyst predictions in our free report on analyst forecasts for the company.
Do Secure Energy Services's Current Liabilities Skew Its ROCE?
Current liabilities are short term bills and invoices that need to be paid in 12 months or less. Due to the way the ROCE equation works, having large bills due in the near term can make it look as though a company has less capital employed, and thus a higher ROCE than usual. To counter this, investors can check if a company has high current liabilities relative to total assets.
Secure Energy Services has total liabilities of CA$174m and total assets of CA$1.6b. As a result, its current liabilities are equal to approximately 11% of its total assets. This is not a high level of current liabilities, which would not boost the ROCE by much.
The Bottom Line On Secure Energy Services's ROCE
Secure Energy Services has a poor ROCE, and there may be better investment prospects out there. Of course, you might also be able to find a better stock than Secure Energy Services. So you may wish to see this free collection of other companies that have grown earnings strongly.
There are plenty of other companies that have insiders buying up shares. You probably do not want to miss this free list of growing companies that insiders are buying.
If you spot an error that warrants correction, please contact the editor at editorial-team@simplywallst.com. This article by Simply Wall St is general in nature. It does not constitute a recommendation to buy or sell any stock, and does not take account of your objectives, or your financial situation. Simply Wall St has no position in the stocks mentioned.
We aim to bring you long-term focused research analysis driven by fundamental data. Note that our analysis may not factor in the latest price-sensitive company announcements or qualitative material. Thank you for reading.
