
 Yahoo Finance
 Sandman drill program summary of results
Figure 1
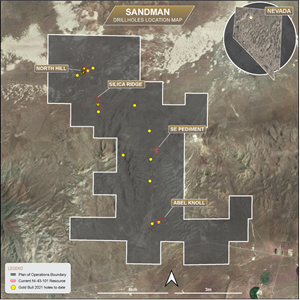
Gold Bull Resources 2021 drill hole collar locations with outlines of current Mineral Resource Estimate.
Figure 2
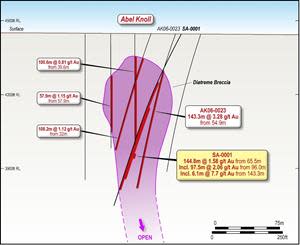
Cross-section of the Abel Knoll diatreme breccia mineralization, including hole SA-0001
Figure 3

Plan view of the Abel Knoll diatreme breccia with drill traces and location of the cross-section shown in Figure 2 above.
Figure 4
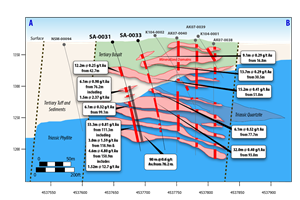
Cross-section of the Abel Knoll strata-bound mineralization, including holes SA-0031 and SA-0033
Figure 5

Plan view of the Abel Knoll strata-bound mineralized domains, including drill traces and location of the cross-section shown in Figure 4 above.
Figure 6
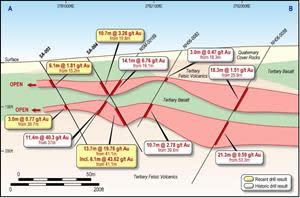
North Hill cross-section showing holes SA-0003 and SA-0004 with historic drilling and mineralized domains
Figure 7
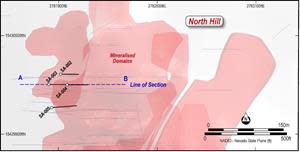
Plan view of the North Hill mineralized domains, with drill traces and location of the cross-section shown in Figure 6 above. Locations of holes SA-0002, SA-0003, SA-0004 and SA-0005 are indicated.
Figure 8

North Hill cross-section showing hole SA-0027 and mineralized domains
Figure 9

Plan view of North Hill mineralized domains with location of the cross-section shown in Figure 8 above
Figure 10

Silica Ridge cross-section showing hole SA-0024 with mineralized domains, marker horizon and interpreted faults
Figure 11
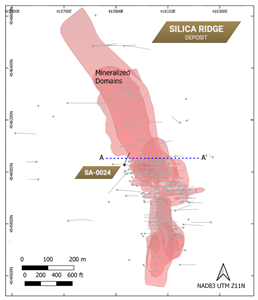
Silica Ridge plan view of mineralized domains, with location of the cross-section shown in Figure 10 above
VANCOUVER, British Columbia, Sept. 07, 2021 (GLOBE NEWSWIRE) -- Gold Bull Resources Corp. (TSX-V: GBRC) (“Gold Bull” or the “Company”) is pleased to report a six-month summary of 2021 drilling results received to date from its 100% owned Sandman Project (“Sandman” or the “Project”) located in Humboldt County, Nevada, USA.
HIGHLIGHTS & UPDATE:
5800m of RC drilled for 33 drill holes – drill program about 50% complete
Significant gold mineralization intersected outside of known gold resources
Current drill program highlights include:
Abel Knoll
SA-0001 intersected 6.1m (20 ft) @ 7.77g/t Au from 143.3m (470 ft) within a broader intercept of 144.8m (475 ft) at 1.58g/t Au from 65.5m (215 ft)
SA-0031 intersected 90 m (295 ft) at 0.6 g/t Au from 76.2 m in a SE extension to the strata-bound mineralization (outside of current resource)
North Hill
SA-0004 intersected 10.7 m (35 ft) at 3.28 g/t Au from 19.8 m (65 ft) and 13.7 m (45 ft) at 19.76 g/t Au from 41.1 m (135 ft) including 6.1 m (20 ft) at 43.62 g/t Au from 41.1 m (135 ft)
SA-0002 intersected 25.9 m (85 ft) at 4.49 g/t Au from 0 m and 12.2m (40 ft) @ 0.95 from 32.0 m (105 ft)
SA-0005 intersected 9.1 m (30 ft) at 4.94 g/t Au from 50.3 m (165 ft), including 4.6 m (15 ft) at 9.53 g/t Au from 53.3 m (175 ft), and 6.1 m (20 ft) at 0.55 g/t Au from 22.9 m (75 ft)
These holes confirm a north-south trending high-grade zone that possibly indicates proximity to a feeder structure that will be targeted at depth
Silica Ridge
SA-0024 intersected 19.8 m (65 ft) at 0.67 g/t Au from 111.3 m (365 ft), including 9.1 m at 1.13 g/t Au from 114.3 m (375 ft) intersected a down-thrown western extension to the known mineralization, revealing a new, largely untested target zone (outside of current resource)
Mineralization remains open in multiple directions and deposits
Main bonanza exploration target (contact of basement and tertiary) has not yet been drill tested – Q4
Gold Bull CEO, Cherie Leeden commented:
“The drilling to date indicates that our current resource at Sandman of circa half a million ounces still has significant room to grow, as indicated by the numerous significant gold hits from this drill program that are located outside of our known resources.
What I am even more excited about is our next round of drilling in Q4, that will focus on and target a very important geological contact of the basement rocks and Tertiary rocks. Although this is the most obvious target to host a bonanza gold deposit, this target zone has been largely ignored by previous explorers who have focussed on the at surface Tertiary gold mineralisation instead of on the most prospective and fertile geological host. Our Geological Advisor, John Wood, the geologist who discovered the nearby Sleeper deposit has shone a light and redirected our focus on the bigger picture at Sandman which we look forward to drilling in Q4 of this year.”
Background
Gold Bull has drilled 33 reverse circulation (RC) holes for a total of 5,804.9 m (19,045 ft) at the Sandman project since the commencement of the exploration program in February 2021. The drill program is incomplete and will recommence in approximately late October-early November. The purpose of the drill program at Sandman is twofold, to expand the current known resources and to identify new gold mineralization.
Assay results have been received for 26 holes, with results for the remaining 7 holes (SA-0022, SA-0023, SA-0025, SA-0026, SA-0028, SA-0029 and SA-0030) expected in September. The Sandman project comprises of four known gold resources, known as Abel Knoll, South East (SE) Pediment, Silica Ridge and North Hill (refer to Figure 1). Most of the drilling (70%) focussed on resource expansion of three of the known resources at Abel Knoll, Silica Ridge and North Hill, all of which remain open at depth. This work defined several areas of mineralization where further drilling could expand the MRE.
Ten drill holes were focussed on exploration targets, mainly targeting structural trends associated with known mineralization and surface geochemical anomalism.
This work has led the Company to expand its Exploration Model to add a focus on areas where mineralizing fluids exited the pre-Tertiary basement. Multi-element geochemical data from historic drill holes identifies several areas at Sandman where mineralizing hydrothermal fluids flowed out of the Triassic basement into more porous overlying Tertiary volcanic and volcaniclastic rocks. These zones occur below the known ore zones. Regionally, high-grade epithermal gold deposits are often located in structural fluid conduits (feeder structures) near the contact between the basement and the overlying volcanic sequence because the drop in pressure around this contact causes changes in fluid chemistry that precipitates gold from solution. Three of the known gold deposits at Sandman, Silica Ridge, North Hill, and SE Pediment occur well above this contact, in areas where the upward migrating gold-bearing fluids were trapped by impermeable layers. The Sandman property has potential to host high-grade gold deposits at lower, untested paleo-elevations. We will be targeting the intersection of the gold-bearing feeder structures at the Triassic-Tertiary contact within the geochemical anomalies outlining the hydrothermal system.
ABEL KNOLL
SA-0001 (Figure 2 and Figure 3) drilled at Abel Knoll improved definition of the mineralized diatreme breccia and intersected a high grade zone returning 6.1m (20 ft) @ 7.77g/t Au from 143.3m (470 ft) within a broader intercept of 144.8m (475 ft) at 1.58g/t Au from 65.5m (215 ft) (refer to press release “Gold Bull intersects 144.8m at 1.67g/t gold, including 6.1m at 10.75g/t gold in maiden drill hole at Sandman” dated March 21, 2021. Average grades reported in this document are recalculated using screen fire assay determinations from re-assaying performed after the original press release.). This high-grade zone remains open at depth.
More recent drilling at Abel Knoll tested the southeastern extent of the strata-bound mineralization occurring in the Tertiary sequence and underlying Triassic basement. Hole SA-0031 (Figure 4 and Figure 5) intersected a mineralized interval of 90 m (295 ft) at 0.6 g/t Au from 76.2 m (refer to press release “Gold Bull Reports Significant New Gold Mineralization Outside of Current Resource at Sandman Including: 90m at 0.6 g/t Au” dated July 28, 2021). Holes SA-0032 and SA-0033, drilled closer to the current Mineral Resource Estimate (MRE), also intersected broad mineralized zones: SA-0031 intersected 32.0 m (105 ft) at 0.40 g/t Au from 93.0 m (305 ft), overlain by four narrower intervals of 9.1 m (30 ft) at 0.29 g/t Au from 16.8 m (55 ft), 13.7 m (45 ft) at 0.29 g/t Au from 30.5 m (100 ft), 15.2 m (50 ft) at 0.41 g/t Au from 51.8 m (170 ft), and 6.1 m (20 ft) at 0.52 g/t Au from 77.7 m (255 ft). SA-0032 intersected 9.1 m (30 ft) at 0.29 g/t Au from 106.7 m (350 ft) and 21.3 m (70 ft) at 0.30 g/t Au from 123.4 m (405 ft). Gold grades within the broad mineralized zone in Triassic basement rocks are influenced by lithology, with the more competent (brittle) rocks (e.g., quartzite, limestone) sometimes containing grades greater than 10 g/t Au. The strata-bound mineralized zone remains open to the south and east.
Figure 2 Cross-section of the Abel Knoll diatreme breccia mineralization, including hole SA-0001
NORTH HILL
Drilling at North Hill achieved two objectives: confirming the extent and geometry of high-grade mineralization and extending the eastern and western edges of the Mineral Resource Estimate (MRE) by confirming that the strata-bound mineralization remains open in both directions.
Hole SA-0004 (Figure 6 and Figure 7) intersected high-grade gold mineralization in both upper and lower ore domains, returning 10.7 m (35 ft) at 3.28 g/t Au from 19.8 m (65 ft) and 13.7 m (45 ft) at 19.76 g/t Au from 41.1 m (135 ft) including 6.1 m (20 ft) at 43.62 g/t Au from 41.1 m (135 ft) (refer to press release “Gold Bull drills several shallow high-grade intercepts including 13.7m @ 10.95 g/t Au from 41.1m; Extends North Hill high-grade gold mineralization at Sandman”, dated March 29, 2021. The intercepts reported here are re-stated based on screen fire assaying of high-grade intervals in SA-0004.). Hole SA-0003 intersected both ore domains to the west, returning 6.1 m at 1.81 g/t Au from 15.2 m and 3.0 m at 0.77 g/t Au from 36.7 m. The lower grade and width of these SA-0003 intercepts compared to those in SA-0004 confirm the localized nature of the high-grade zone, which may relate to a high-angle mineralized structure intersecting the favorable basalt units, an attractive exploration target. The lower high-grade zone was also intersected to the south by SA-0005, which returned 9.1 m (30 ft) at 4.94 g/t Au from 50.3 m (165 ft), including 4.6 m (15 ft) at 9.53 g/t Au from 53.3 m (175 ft), and 6.1 m (20 ft) at 0.55 g/t Au from 22.9 m (75 ft). The SA-0003 intercepts confirm that the strata-bound mineralization on the western side of the North Hill MRE extends beyond the historic drilling.
Hole SA-0027 (Figure 8 and Figure 9) was drilled beneath the uppermost ore domain on the edge of the MRE to test for eastern extensions of the lower ore domains (refer to press release “Gold Bull Reports Sandman Drill Holes at North Hill and Silica Ridge Intersect Gold Mineralization Outside of Current Resource”, dated July 21, 2021). The hole intersected 19.8 m (65 ft) @ 0.6 g/t Au from 4.6 m (15 ft), (including: 6.1 m (20 ft) @ 1.18 g/t Au from 9.1 m (30 ft)) from the uppermost ore domain, as well as 15.2 m (50 ft) @ 0.39 g/t Au from 30.5 m (100 ft), and 21.3 m (70 ft) @ 0.44 g/t Au from 51.8 m (170 ft), confirming that the lower ore domains are open to the east. The bottom of the deepest interval of gold mineralization in SA-0027 is 65 m (213 ft) vertical depth below surface, which is within range of a possible open pit design.
Figure 8 North Hill cross-section showing hole SA-0027 and mineralized domains
SILICA RIDGE
Holes SA-0008 and SA-0009 at Silica Ridge were drilled to improve definition of low-grade strata-bound ore zones within the Mineral Resource Estimate (MRE). Both holes intersected mineralization consistent with historic drill results (see Table 1). Hole SA-0024 (Figure 10 and Figure 11) was drilled to test for down-thrown mineralization on the western side of a fault defining the western edge of the current MRE. The hole intersected 19.8 m (65 ft) at 0.67 g/t Au from 111.3 m (365 ft), including 9.1 m at 1.13 g/t Au from 114.3 m (375 ft), above the Oligocene fiamme tuff marker unit that underlies the mineralization within the MRE to the east of the fault. This marker unit outcrops to the west of the drill hole, indicating potential for the mineralization to extend up-dip to shallower positions. This result supports the exploration potential of an extensive under-explored area west of the Silica Ridge MRE.
Table 1 Summary of intersections to date from the 2021 Sandman drilling program
Hole ID | From | To | Width | From | To | Width | Gold ppm (Au g/t) | |||||
SA-0001 | 65.5 | 210.3 | 144.8 | 215 | 690 | 475 | 1.58* (using 0.2 g/t Au cut-off) | |||||
including | 96 | 193.55 | 97.55 | 315 | 635 | 320 | 2.06* (using 1 g/t Au cut-off) | |||||
SA-0001 | 143.25 | 149.35 | 6.1 | 470 | 490 | 20 | 7.77 (using 5 g/t Au cut-off) | |||||
SA-0002 | 0 | 25.9 | 25.9 | 0 | 85 | 85 | 4.48 (using 0.2 g/t Au cut-off) | |||||
SA-0002 | 32 | 44.2 | 12.2 | 105 | 145 | 40 | 0.95 (using 0.2 g/t Au cut-off) | |||||
SA-0003 | 15.2 | 21.3 | 6.1 | 50 | 70 | 20 | 1.81 (using 0.2 g/t Au cut-off) | |||||
SA-0003 | 36.6 | 39.6 | 3 | 120 | 130 | 10 | 0.77 (using 0.2 g/t cut-off) | |||||
SA-0004 | 19.8 | 30.5 | 10.7 | 65 | 100 | 35 | 3.28 (using 0.2 g/t Au cut-off) | |||||
SA-0004 | 41.1 | 54.9 | 13.7 | 135 | 180 | 45 | 10.95 (using 0.2 g/t Au cut-off) | |||||
including | 41.1 | 47.2 | 6.1 | 135 | 155 | 20 | 43.62 (using 5 g/t Au cut-off) | |||||
SA-0005 | 22.9 | 29 | 6.1 | 75 | 95 | 20 | 0.55 (using 0.2 g/t Au cut-off) | |||||
SA-0005 | 50.3 | 59.4 | 9.1 | 165 | 195 | 30 | 4.94 (using 0.2 g/t Au cut-off) | |||||
including | 53.3 | 57.9 | 4.6 | 175 | 190 | 15 | 9.53 (using 5 g/t Au cut-off) | |||||
SA-0006 | NSI | |||||||||||
SA-0007 | 10.7 | 25.9 | 15.2 | 35 | 85 | 50 | 0.37 (using 0.2 g/t Au cut-off and internal dilution up to 1.5 m width) | |||||
SA-0008 | 68.6 | 103.6 | 35.1 | 225 | 340 | 115 | 0.27 (using 0.2 g/t Au cut-off and internal dilution up to 4.5 m width) | |||||
SA-0009 | 56.4 | 68.6 | 12.2 | 185 | 225 | 40 | 0.20 (using 0.2 g/t Au cut-off and internal dilution up to 4.5 m width) | |||||
SA-0009 | 77.7 | 118.9 | 41.1 | 255 | 390 | 135 | 0.76 (using 0.2 g/t Au cut-off and internal dilution up to 3 m width) | |||||
including | 102.1 | 105.2 | 3.0 | 335 | 345 | 10 | 5.56 (using 5 g/t Au cut-off) | |||||
SA-0010, SA-0011, SA-0012, SA-0013 and SA-0014 | NSI | |||||||||||
SA-0015 | 15.2 | 21.3 | 6.1 | 50 | 70 | 20 | 0.50 (using 0.2 g/t Au cut-off) | |||||
SA-0015 | 50.3 | 54.9 | 4.6 | 165 | 180 | 15 | 0.57 (using 0.2 g/t Au cut-off) | |||||
SA-0016 | 120.4 | 125.0 | 4.6 | 395 | 410 | 15 | 0.38 (using 0.2 g/t Au cut-off) | |||||
SA-0017 | 22.9 | 25.9 | 3.0 | 75 | 85 | 10 | 0.29 (using 0.2 g/t Au cut-off) | |||||
SA-0018 | 25.9 | 27.4 | 1.5 | 85 | 90 | 5 | 2.32 | |||||
SA-0018 | 65.5 | 73.2 | 7.6 | 215 | 240 | 25 | 0.21 (using 0.2 g/t Au cut-off and internal dilution up to 1.5 m) | |||||
SA-0019 | 79.2 | 85.3 | 6.1 | 260 | 280 | 20 | 1.04 (using 0.2 g/t Au cut-off) | |||||
SA-0020 | 85.3 | 86.9 | 1.5 | 280 | 285 | 5 | 0.50 | |||||
SA-0021 | NSI | |||||||||||
Assays pending for SA-0022 and SA-0023 | ||||||||||||
SA-0024 | 111.3 | 131.1 | 19.8 | 365 | 430 | 65 | 0.67 (using 0.2 g/t Au cut-off, inc. 4.6 m internal dilution) | |||||
including | 114.3 | 123.4 | 9.1 | 375 | 405 | 30 | 1.13 (using 0.5 g/t Au cut-off) | |||||
Assays pending for SA-0025 and SA-0026 | ||||||||||||
SA-0027 | 4.6 | 24.4 | 19.8 | 15 | 80 | 65 | 0.60 (using 0.2 g/t Au cut-off, inc. 1.5 m internal dilution) | |||||
including | 9.1 | 15.2 | 6.1 | 30 | 50 | 20 | 1.18 (using 0.9 g/t Au cut-off) | |||||
SA-0027 | 30.5 | 45.7 | 15.2 | 100 | 150 | 50 | 0.39 (using 0.2 g/t Au cut-off) | |||||
SA-0027 | 51.8 | 73.2 | 21.3 | 170 | 240 | 70 | 0.44 (using 0.2 g/t Au cut-off) | |||||
Assays pending for SA-0028, SA-0029 and SA-0030 | ||||||||||||
SA-0031 | 42.7 | 54.9 | 12.2 | 140 | 180 | 40 | 0.25 (using 0.2 g/t Au cut-off) | |||||
SA-0031 | 76.2 | 82.3 | 6.1 | 250 | 270 | 20 | 0.98 (using 0.2 g/t Au cut-off) | |||||
SA-0031 | 99.1 | 105.2 | 6.1 | 325 | 345 | 20 | 0.32 (using 0.2 g/t Au cut-off) | |||||
SA-0031 | 111.3 | 164.6 | 53.3 | 365 | 540 | 175 | 0.81 (using 0.2 g/t cut-off and including up to 4.6 m or 15 ft of internal dilution) | |||||
including | 118.9 | 121.9 | 3.0 | 390 | 400 | 10 | 1.59 (using 0.8 g/t cut-off) | |||||
and | 150.9 | 155.4 | 4.6 | 495 | 510 | 15 | 4.80 (using 0.75 g/t cut-off) | |||||
SA-0032 | 106.7 | 115.8 | 9.1 | 350 | 380 | 30 | 0.29 (using 0.2 g/t Au cut-off and internal dilution up to 1.5 m) | |||||
SA-0032 | 123.4 | 144.8 | 21.3 | 405 | 475 | 70 | 0.29 (using 0.2 g/t Au cut-off and internal dilution up to 1.5 m) | |||||
SA-0033 | 16.8 | 25.9 | 9.1 | 55 | 85 | 30 | 0.29 g/t Au (using 0.2 g/t Au cut-off and internal dilution up to 1.5 m) | |||||
SA-0033 | 30.5 | 44.2 | 13.7 | 100 | 145 | 45 | 0.29 g/t Au (using 0.2 g/t Au cut-off and internal dilution up to 1.5 m) | |||||
SA-0033 | 51.8 | 67.1 | 15.2 | 170 | 220 | 50 | 0.41 g/t Au (using 0.2 g/t Au cut-off and internal dilution up to 1.5 m) | |||||
SA-0033 | 77.7 | 83.8 | 6.1 | 255 | 275 | 20 | 0.52 g/t Au (using 0.2 g/t Au cut-off) | |||||
SA-0033 | 93.0 | 125.0 | 32.0 | 305 | 410 | 105 | 0.40 g/t Au (using 0.2 g/t Au cut-off and internal dilution up to 4.6 m) | |||||
* Drill hole intersection includes a 4.6m interval (123.4m to 128.0m) where the hole intersected a void and no sample was recovered therefore zero (0) g/t Au was used for that interval.
Table 2 Summary of drill hole collar information
Hole ID | Total | Easting | Northing | Elevation | Coordinate | Azimuth | Dip collar |
SA-0001 | 228.6 | 420234 | 4537635 | 1355.6 | NAD83 UTM Zone 11N | 7.5 | -61.4 |
SA-0002 | 76.2 | 414924 | 4548596 | 1368.4 | NAD83 UTM Zone 11N | 90.3 | -59.9 |
SA-0003 | 76.2 | 414899 | 4548578 | 1364.3 | NAD83 UTM Zone 11N | 89.2 | -57.8 |
SA-0004 | 76.2 | 414932 | 4548580 | 1368.3 | NAD83 UTM Zone 11N | 89.4 | -59.5 |
SA-0005 | 106.7 | 414906 | 4548536 | 1364.2 | NAD83 UTM Zone 11N | 85.4 | -59.0 |
SA-0006 | 181.4 | 414815 | 4548247 | 1359.2 | NAD83 UTM Zone 11N | 92.1 | -60.6 |
SA-0007 | 166.1 | 414874 | 4548246 | 1363.3 | NAD83 UTM Zone 11N | 92.2 | -59.2 |
SA-0008 | 167.6 | 415936 | 4546025 | 1391.8 | NAD83 UTM Zone 11N | 86.6 | -60.4 |
SA-0009 | 167.6 | 415944 | 4545993 | 1391.6 | NAD83 UTM Zone 11N | 86.1 | -59.5 |
SA-0010 | 201.2 | 415940 | 4545492 | 1380.1 | NAD83 UTM Zone 11N | 270.3 | -59.3 |
SA-0011 | 272.8 | 419574 | 4544132 | 1336.5 | NAD83 UTM Zone 11N | 83.8 | -69.4 |
SA-0012 | 275.8 | 419774 | 4537528 | 1342.4 | NAD83 UTM Zone 11N | 94.6 | -53.8 |
SA-0013 | 221.0 | 417706 | 4542411 | 1416.9 | NAD83 UTM Zone 11N | 269.4 | -59.4 |
SA-0014 | 323.1 | 419667 | 4542111 | 1376.1 | NAD83 UTM Zone 11N | 266.1 | -52.1 |
SA-0015 | 163.1 | 414834 | 4548292 | 1360.9 | NAD83 UTM Zone 11N | 87.6 | -59.6 |
SA-0016 | 153.9 | 414865 | 4548291 | 1363.1 | NAD83 UTM Zone 11N | 88.2 | -57.0 |
SA-0017 | 158.5 | 414897 | 4548292 | 1365.3 | NAD83 UTM Zone 11N | 90.6 | -59.1 |
SA-0018 | 161.5 | 414861 | 4548349 | 1362.3 | NAD83 UTM Zone 11N | 88.3 | -59.7 |
SA-0019 | 166.1 | 414891 | 4548349 | 1364.7 | NAD83 UTM Zone 11N | 87.0 | -59.9 |
SA-0020 | 152.4 | 414916 | 4548349 | 1367.2 | NAD83 UTM Zone 11N | 89.4 | -59.5 |
SA-0021 | 182.9 | 418519 | 4545945 | 1354.1 | NAD83 UTM Zone 11N | 272.1 | -71.9 |
SA-0022 | 243.8 | 419605 | 4540565 | 1405.6 | NAD83 UTM Zone 11N | 97.7 | -54.8 |
SA-0023 | 105.2 | 415556 | 4548602 | 1378.3 | NAD83 UTM Zone 11N | 108.1 | -59.6 |
SA-0024 | 182.9 | 415933 | 4546027 | 1391.4 | NAD83 UTM Zone 11N | 20.5 | -65.7 |
SA-0025 | 199.6 | 415940 | 4545990 | 1391.4 | NAD83 UTM Zone 11N | 219.7 | -54.7 |
SA-0026 | 153.9 | 415891 | 4546030 | 1385.7 | NAD83 UTM Zone 11N | 87.3 | -59.5 |
SA-0027 | 126.5 | 415208 | 4548414 | 1399.3 | NAD83 UTM Zone 11N | 270.9 | -60.1 |
SA-0028 | 147.8 | 414907 | 4548255 | 1366.0 | NAD83 UTM Zone 11N | 88.4 | -60.9 |
SA-0029 | 196.6 | 414440 | 4548082 | 1348.8 | NAD83 UTM Zone 11N | 269.8 | -54.8 |
SA-0030 | 199.6 | 415508 | 4546148 | 1372.3 | NAD83 UTM Zone 11N | 89.7 | -55.9 |
SA-0031 | 179.8 | 420572 | 4537648 | 1370.4 | NAD83 UTM Zone 11N | 354.1 | -70.5 |
SA-0032 | 210.3 | 420517 | 4537645 | 1367.1 | NAD83 UTM Zone 11N | 358.1 | -70.7 |
SA-0033 | 179.8 | 420575 | 4537688 | 1372.7 | NAD83 UTM Zone 11N | 359.8 | -68.9 |
NEXT STEPS
The Company is still awaiting assay results from seven holes and in the meantime is conducting surface geochemical sampling over an area where Controlled Source Audio Magnetotelluric (CSAMT) surveying is scheduled for September. This program covers a largely untested, approximately 3 km long, east-west trending structural zone containing a dyke that hosts high grade gold mineralization within the current Silica Ridge MRE. The Company is also developing drilling targets based on the expanded exploration model outlined above, which will be announced shortly.
About Sandman
In December 2020, Gold Bull purchased the Sandman Project from Newmont. Gold mineralization was first discovered at Sandman in 1987 by Kennecott and the project has been intermittently explored since then. There are four known pit constrained gold resources located within the Sandman Project, consisting of 21.8Mt @ 0.7g/t gold for 494,000 ounces of gold; comprising of an Indicated Resource of 18,550kt @ 0.73g/t gold for 433kozs of gold plus an Inferred Resource of 3,246kt @ 0.58g/t gold for 61kozs of gold. Several of the resources remain open in multiple directions and the bulk of the historical drilling has been conducted to a depth of less than 100m. Sandman is conveniently located circa 30 km northwest of the mining town of Winnemucca, Nevada.
Qualified Person
Cherie Leeden, B.Sc Applied Geology (Honours), MAIG, a “Qualified Person” as defined by National Instrument 43-101, has read and approved all technical and scientific information contained in this news release. Ms. Leeden is the Company’s Chief Executive Officer. Cherie Leeden relied on resource information contained within the Technical Report on the Sandman Gold Project, prepared by Steven Olsen, a Qualified Person under NI 43-101, who is a Qualified Persons as defined by the National Instrument NI 43-101. Mr Olsen is an independent consultant and has no affiliations with Gold Bull except that of an independent consultant/client relationship. Mr Olsen is a member of the Australian Institute of Geoscientists (AIG) and is the Qualified Person under NI 43-101, Standards of Disclosure for Mineral Projects.
Quality Assurance – Quality Control
Drilling was completed using Reverse Circulation (RC) drilling utilizing double wall drill pipe, interchange hammer and 4¾ inch hammer bits to drill and sample the rock formation. Samples were taken over 5 foot intervals (1.52m) and were collected after separation of the sample using a rotary splitter situated at the base of the cyclone. A small portion of the rock chips for each 5 foot interval was placed into chip trays for record keeping and geological logging. The samples bagged at the rig were taken to American Assay Laboratories in Sparks NV by a Company employee. The Company inserts quality control (QC) samples at regular intervals in the sample stream, including blanks and reference materials with all sample shipments to monitor laboratory performance. The QAQC program is overseen by the Company’s Qualified Person, Cherie Leeden, Chief Executive Officer.
Samples are submitted to American Assay Laboratories’ analytical facility in Sparks, Nevada for preparation and analysis. The AAL facility is ISO-17025 accredited by IAS. The entire sample is dried, weighed and crushed, with 85% passing -10 mesh, then riffle split to 1 kg aliquots, which are fine pulverized with 90% passing -150mesh. Analysis for gold is by 50 g fire assay lead collection with Inductively Coupled Plasma Optical Emission Spectroscopy (ICP-OES) finish with a lower limit of 0.003 ppm (Samples from holes SA-0001 to SA-0021 inclusive were assayed using a 30 g charge). Samples with gold assays above 10 ppm are re-analyzed using a 50 g fire assay fusion with gravimetric finish, which has a lower detection limit of 0.1029 ppm. Samples from high-grade intervals in SA-0001 and SA-0004 were re-submitted for screen fire assay so the average grades are re-calculated using these results in this press release. Ten foot composite samples were also analyzed using a 35 multi-element (plus Se and Hg) geochemical package by 5-acid digestion, followed by Inductively Coupled Plasma Atomic Emission Spectroscopy (ICP-AES) and Inductively Coupled Plasma Mass Spectroscopy (ICP-MS).
About Gold Bull Resources Corp.
Gold Bull’s mission is to grow into a US focused mid-tier gold development Company via rapidly discovering and acquiring additional ounces. The company’s exploration hub is based in Nevada, USA, a top-tier mineral district that contains significant historical production, existing mining infrastructure and an established mining culture. Gold Bull is led by a Board and Management team with a track record of exploration and acquisition success.
Gold Bull’s core asset is the Sandman Project, located in Nevada which has a 494,000 oz gold resource as per 2021 43-101 Resource Estimate. Sandman is located 23 km south of the Sleeper Mine and boasts excellent large-scale exploration potential. Drilling at Sandman is currently underway.
Gold Bull is driven by its core values and purpose which includes a commitment to safety, communication & transparency, environmental responsibility, community, and integrity.
Cherie Leeden
President and CEO, Gold Bull Resources Corp.
For further information regarding Gold Bull Resources Corp., please visit our website at www.goldbull.ca or email admin@goldbull.ca.
Cautionary Note Regarding Forward-Looking Statements
Neither the TSX Venture Exchange nor its Regulation Services Provider (as that term is defined in the policies of the TSX Venture Exchange) accepts responsibility for the adequacy or accuracy of this release.
This news release contains certain statements that may be deemed “forward-looking statements” with respect to the Company within the meaning of applicable securities laws. Forward-looking statements are statements that are not historical facts and are generally, but not always, identified by the words “expects”, “plans”, “anticipates”, “believes”, “intends”, “estimates”, “projects”, “potential”, “indicates”, “opportunity”, “possible” and similar expressions, or that events or conditions “will”, “would”, “may”, “could” or “should” occur. Although Gold Bull believes the expectations expressed in such forward-looking statements are based on reasonable assumptions, such statements are not guarantees of future performance, are subject to risks and uncertainties, and actual results or realities may differ materially from those in the forward-looking statements. Such material risks and uncertainties include, but are not limited to, the Company’s ability to raise sufficient capital to fund its obligations under its property agreements going forward, to maintain its mineral tenures and concessions in good standing, to explore and develop its projects, to repay its debt and for general working capital purposes; changes in economic conditions or financial markets; the inherent hazards associates with mineral exploration and mining operations, future prices of copper and other metals, changes in general economic conditions, accuracy of mineral resource and reserve estimates, the potential for new discoveries, the ability of the Company to obtain the necessary permits and consents required to explore, drill and develop the projects and if obtained, to obtain such permits and consents in a timely fashion relative to the Company’s plans and business objectives for the projects; the general ability of the Company to monetize its mineral resources; and changes in environmental and other laws or regulations that could have an impact on the Company’s operations, compliance with environmental laws and regulations, dependence on key management personnel and general competition in the mining industry. Forward-looking statements are based on the reasonable beliefs, estimates and opinions of the Company’s management on the date the statements are made. Except as required by law, the Company undertakes no obligation to update these forward-looking statements in the event that management’s beliefs, estimates or opinions, or other factors, should change.

