
 Yahoo Finance
 Saia's (NASDAQ:SAIA) 52% CAGR outpaced the company's earnings growth over the same five-year period
We think all investors should try to buy and hold high quality multi-year winners. And we've seen some truly amazing gains over the years. To wit, the Saia, Inc. (NASDAQ:SAIA) share price has soared 705% over five years. And this is just one example of the epic gains achieved by some long term investors. Also pleasing for shareholders was the 22% gain in the last three months. We love happy stories like this one. The company should be really proud of that performance!
Since it's been a strong week for Saia shareholders, let's have a look at trend of the longer term fundamentals.
View our latest analysis for Saia
To paraphrase Benjamin Graham: Over the short term the market is a voting machine, but over the long term it's a weighing machine. One flawed but reasonable way to assess how sentiment around a company has changed is to compare the earnings per share (EPS) with the share price.
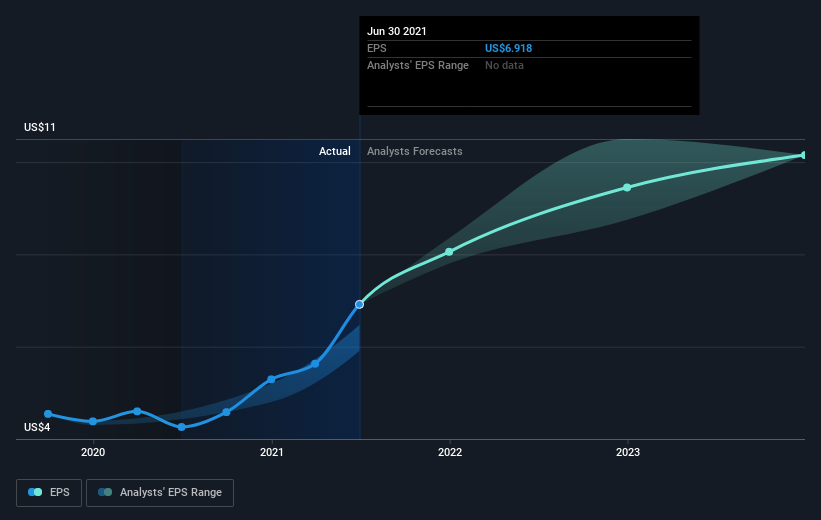
During five years of share price growth, Saia achieved compound earnings per share (EPS) growth of 30% per year. This EPS growth is slower than the share price growth of 52% per year, over the same period. So it's fair to assume the market has a higher opinion of the business than it did five years ago. That's not necessarily surprising considering the five-year track record of earnings growth.
The company's earnings per share (over time) is depicted in the image below (click to see the exact numbers).
We're pleased to report that the CEO is remunerated more modestly than most CEOs at similarly capitalized companies. But while CEO remuneration is always worth checking, the really important question is whether the company can grow earnings going forward. It might be well worthwhile taking a look at our free report on Saia's earnings, revenue and cash flow.
A Different Perspective
We're pleased to report that Saia shareholders have received a total shareholder return of 90% over one year. Since the one-year TSR is better than the five-year TSR (the latter coming in at 52% per year), it would seem that the stock's performance has improved in recent times. Someone with an optimistic perspective could view the recent improvement in TSR as indicating that the business itself is getting better with time. I find it very interesting to look at share price over the long term as a proxy for business performance. But to truly gain insight, we need to consider other information, too. Case in point: We've spotted 1 warning sign for Saia you should be aware of.
If you like to buy stocks alongside management, then you might just love this free list of companies. (Hint: insiders have been buying them).
Please note, the market returns quoted in this article reflect the market weighted average returns of stocks that currently trade on US exchanges.
This article by Simply Wall St is general in nature. We provide commentary based on historical data and analyst forecasts only using an unbiased methodology and our articles are not intended to be financial advice. It does not constitute a recommendation to buy or sell any stock, and does not take account of your objectives, or your financial situation. We aim to bring you long-term focused analysis driven by fundamental data. Note that our analysis may not factor in the latest price-sensitive company announcements or qualitative material. Simply Wall St has no position in any stocks mentioned.
Have feedback on this article? Concerned about the content? Get in touch with us directly. Alternatively, email editorial-team (at) simplywallst.com.
