
 Yahoo Finance
 Are Robust Financials Driving The Recent Rally In PerkinElmer, Inc.'s (NYSE:PKI) Stock?
PerkinElmer's (NYSE:PKI) stock is up by a considerable 8.0% over the past month. Given the company's impressive performance, we decided to study its financial indicators more closely as a company's financial health over the long-term usually dictates market outcomes. In this article, we decided to focus on PerkinElmer's ROE.
ROE or return on equity is a useful tool to assess how effectively a company can generate returns on the investment it received from its shareholders. Simply put, it is used to assess the profitability of a company in relation to its equity capital.
Check out our latest analysis for PerkinElmer
How To Calculate Return On Equity?
Return on equity can be calculated by using the formula:
Return on Equity = Net Profit (from continuing operations) ÷ Shareholders' Equity
So, based on the above formula, the ROE for PerkinElmer is:
16% = US$1.1b ÷ US$7.0b (Based on the trailing twelve months to October 2021).
The 'return' is the income the business earned over the last year. So, this means that for every $1 of its shareholder's investments, the company generates a profit of $0.16.
What Is The Relationship Between ROE And Earnings Growth?
Thus far, we have learned that ROE measures how efficiently a company is generating its profits. Depending on how much of these profits the company reinvests or "retains", and how effectively it does so, we are then able to assess a company’s earnings growth potential. Generally speaking, other things being equal, firms with a high return on equity and profit retention, have a higher growth rate than firms that don’t share these attributes.
PerkinElmer's Earnings Growth And 16% ROE
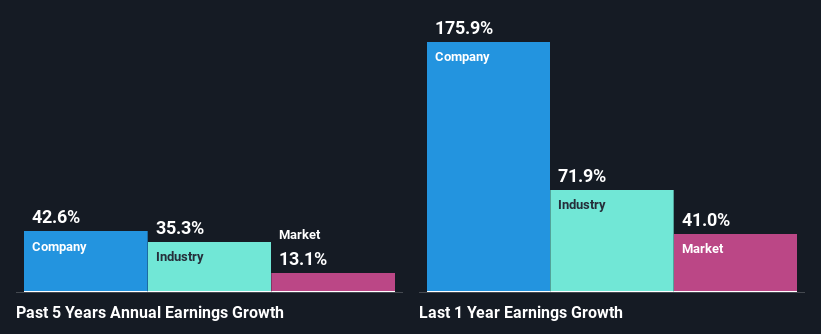
To start with, PerkinElmer's ROE looks acceptable. Even when compared to the industry average of 16% the company's ROE looks quite decent. This probably goes some way in explaining PerkinElmer's significant 43% net income growth over the past five years amongst other factors. We believe that there might also be other aspects that are positively influencing the company's earnings growth. Such as - high earnings retention or an efficient management in place.
As a next step, we compared PerkinElmer's net income growth with the industry, and pleasingly, we found that the growth seen by the company is higher than the average industry growth of 35%.
Earnings growth is a huge factor in stock valuation. What investors need to determine next is if the expected earnings growth, or the lack of it, is already built into the share price. By doing so, they will have an idea if the stock is headed into clear blue waters or if swampy waters await. Is PKI fairly valued? This infographic on the company's intrinsic value has everything you need to know.
Is PerkinElmer Using Its Retained Earnings Effectively?
PerkinElmer's three-year median payout ratio to shareholders is 11%, which is quite low. This implies that the company is retaining 89% of its profits. So it looks like PerkinElmer is reinvesting profits heavily to grow its business, which shows in its earnings growth.
Besides, PerkinElmer has been paying dividends for at least ten years or more. This shows that the company is committed to sharing profits with its shareholders. Our latest analyst data shows that the future payout ratio of the company is expected to drop to 3.6% over the next three years. However, PerkinElmer's future ROE is expected to decline to 13% despite the expected decline in its payout ratio. We infer that there could be other factors that could be steering the foreseen decline in the company's ROE.
Summary
Overall, we are quite pleased with PerkinElmer's performance. In particular, it's great to see that the company is investing heavily into its business and along with a high rate of return, that has resulted in a sizeable growth in its earnings. That being so, according to the latest industry analyst forecasts, the company's earnings are expected to shrink in the future. To know more about the company's future earnings growth forecasts take a look at this free report on analyst forecasts for the company to find out more.
This article by Simply Wall St is general in nature. We provide commentary based on historical data and analyst forecasts only using an unbiased methodology and our articles are not intended to be financial advice. It does not constitute a recommendation to buy or sell any stock, and does not take account of your objectives, or your financial situation. We aim to bring you long-term focused analysis driven by fundamental data. Note that our analysis may not factor in the latest price-sensitive company announcements or qualitative material. Simply Wall St has no position in any stocks mentioned.
Have feedback on this article? Concerned about the content? Get in touch with us directly. Alternatively, email editorial-team (at) simplywallst.com.
