
 Yahoo Finance
 Can Robex Resources Inc’s (CVE:RBX) ROE Continue To Surpass The Industry Average?

The content of this article will benefit those of you who are starting to educate yourself about investing in the stock market and want to begin learning the link between company’s fundamentals and stock market performance.
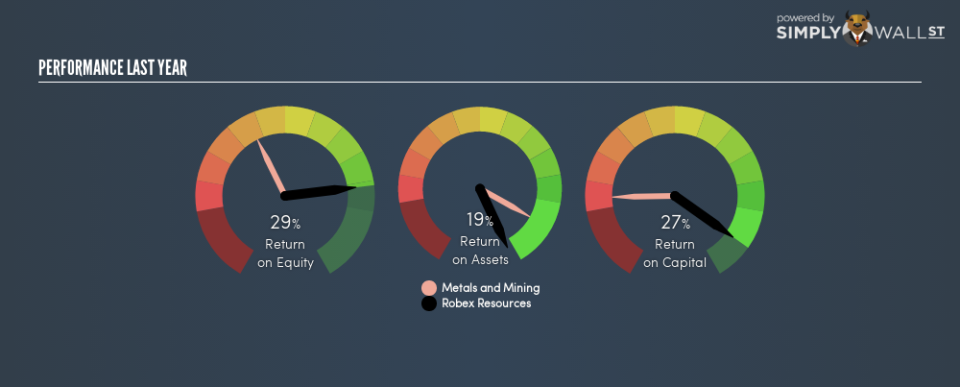
Robex Resources Inc (CVE:RBX) delivered an ROE of 29.3% over the past 12 months, which is an impressive feat relative to its industry average of 11.8% during the same period. While the impressive ratio tells us that RBX has made significant profits from little equity capital, ROE doesn’t tell us if RBX has borrowed debt to make this happen. Today, we’ll take a closer look at some factors like financial leverage to see how sustainable RBX’s ROE is.
Check out our latest analysis for Robex Resources
Breaking down Return on Equity
Return on Equity (ROE) weighs Robex Resources’s profit against the level of its shareholders’ equity. It essentially shows how much the company can generate in earnings given the amount of equity it has raised. While a higher ROE is preferred in most cases, there are several other factors we should consider before drawing any conclusions.
Return on Equity = Net Profit ÷ Shareholders Equity
ROE is measured against cost of equity in order to determine the efficiency of Robex Resources’s equity capital deployed. Its cost of equity is 17.7%. Given a positive discrepancy of 11.6% between return and cost, this indicates that Robex Resources pays less for its capital than what it generates in return, which is a sign of capital efficiency. ROE can be dissected into three distinct ratios: net profit margin, asset turnover, and financial leverage. This is called the Dupont Formula:
Dupont Formula
ROE = profit margin × asset turnover × financial leverage
ROE = (annual net profit ÷ sales) × (sales ÷ assets) × (assets ÷ shareholders’ equity)
ROE = annual net profit ÷ shareholders’ equity
The first component is profit margin, which measures how much of sales is retained after the company pays for all its expenses. The other component, asset turnover, illustrates how much revenue Robex Resources can make from its asset base. Finally, financial leverage will be our main focus today. It shows how much of assets are funded by equity and can show how sustainable the company’s capital structure is. Since ROE can be inflated by excessive debt, we need to examine Robex Resources’s debt-to-equity level. Currently the debt-to-equity ratio stands at a reasonable 56.7%, which means its above-average ROE is driven by its ability to grow its profit without a significant debt burden.

Next Steps:
ROE is a simple yet informative ratio, illustrating the various components that each measure the quality of the overall stock. Robex Resources’s ROE is impressive relative to the industry average and also covers its cost of equity. ROE is not likely to be inflated by excessive debt funding, giving shareholders more conviction in the sustainability of high returns. Although ROE can be a useful metric, it is only a small part of diligent research.
For Robex Resources, I’ve compiled three relevant aspects you should further examine:
Financial Health: Does it have a healthy balance sheet? Take a look at our free balance sheet analysis with six simple checks on key factors like leverage and risk.
Valuation: What is Robex Resources worth today? Is the stock undervalued, even when its growth outlook is factored into its intrinsic value? The intrinsic value infographic in our free research report helps visualize whether Robex Resources is currently mispriced by the market.
Other High-Growth Alternatives : Are there other high-growth stocks you could be holding instead of Robex Resources? Explore our interactive list of stocks with large growth potential to get an idea of what else is out there you may be missing!
To help readers see past the short term volatility of the financial market, we aim to bring you a long-term focused research analysis purely driven by fundamental data. Note that our analysis does not factor in the latest price-sensitive company announcements.
The author is an independent contributor and at the time of publication had no position in the stocks mentioned. For errors that warrant correction please contact the editor at editorial-team@simplywallst.com.
