
 Yahoo Finance
 RM (LON:RM.) shareholders are up 18% this past week, but still in the red over the last three years
It is doubtless a positive to see that the RM plc (LON:RM.) share price has gained some 66% in the last three months. But the last three years have seen a terrible decline. To wit, the share price sky-dived 82% in that time. So it sure is nice to see a bit of an improvement. Only time will tell if the company can sustain the turnaround. We really feel for shareholders in this scenario. It's a good reminder of the importance of diversification, and it's worth keeping in mind there's more to life than money, anyway.
On a more encouraging note the company has added UK£6.3m to its market cap in just the last 7 days, so let's see if we can determine what's driven the three-year loss for shareholders.
View our latest analysis for RM
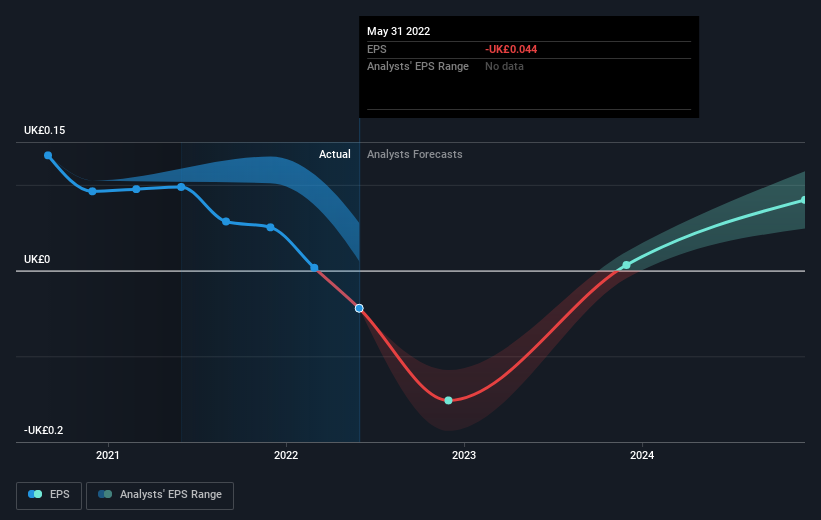
To paraphrase Benjamin Graham: Over the short term the market is a voting machine, but over the long term it's a weighing machine. One flawed but reasonable way to assess how sentiment around a company has changed is to compare the earnings per share (EPS) with the share price.
Over the three years that the share price declined, RM's earnings per share (EPS) dropped significantly, falling to a loss. Since the company has fallen to a loss making position, it's hard to compare the change in EPS with the share price change. However, we can say we'd expect to see a falling share price in this scenario.
You can see below how EPS has changed over time (discover the exact values by clicking on the image).
It might be well worthwhile taking a look at our free report on RM's earnings, revenue and cash flow.
A Different Perspective
We regret to report that RM shareholders are down 74% for the year. Unfortunately, that's worse than the broader market decline of 4.8%. However, it could simply be that the share price has been impacted by broader market jitters. It might be worth keeping an eye on the fundamentals, in case there's a good opportunity. Unfortunately, last year's performance may indicate unresolved challenges, given that it was worse than the annualised loss of 12% over the last half decade. We realise that Baron Rothschild has said investors should "buy when there is blood on the streets", but we caution that investors should first be sure they are buying a high quality business. I find it very interesting to look at share price over the long term as a proxy for business performance. But to truly gain insight, we need to consider other information, too. To that end, you should learn about the 3 warning signs we've spotted with RM (including 2 which are significant) .
If you would prefer to check out another company -- one with potentially superior financials -- then do not miss this free list of companies that have proven they can grow earnings.
Please note, the market returns quoted in this article reflect the market weighted average returns of stocks that currently trade on GB exchanges.
Have feedback on this article? Concerned about the content? Get in touch with us directly. Alternatively, email editorial-team (at) simplywallst.com.
This article by Simply Wall St is general in nature. We provide commentary based on historical data and analyst forecasts only using an unbiased methodology and our articles are not intended to be financial advice. It does not constitute a recommendation to buy or sell any stock, and does not take account of your objectives, or your financial situation. We aim to bring you long-term focused analysis driven by fundamental data. Note that our analysis may not factor in the latest price-sensitive company announcements or qualitative material. Simply Wall St has no position in any stocks mentioned.
Join A Paid User Research Session
You’ll receive a US$30 Amazon Gift card for 1 hour of your time while helping us build better investing tools for the individual investors like yourself. Sign up here
