
 Yahoo Finance
 A Rising Share Price Has Us Looking Closely At Wi2Wi Corporation's (CVE:YTY) P/E Ratio

Wi2Wi (CVE:YTY) shareholders are no doubt pleased to see that the share price has had a great month, posting a 30% gain, recovering from prior weakness. But shareholders may not all be feeling jubilant, since the share price is still down 19% in the last year.
All else being equal, a sharp share price increase should make a stock less attractive to potential investors. While the market sentiment towards a stock is very changeable, in the long run, the share price will tend to move in the same direction as earnings per share. The implication here is that deep value investors might steer clear when expectations of a company are too high. One way to gauge market expectations of a stock is to look at its Price to Earnings Ratio (PE Ratio). Investors have optimistic expectations of companies with higher P/E ratios, compared to companies with lower P/E ratios.
Check out our latest analysis for Wi2Wi
How Does Wi2Wi's P/E Ratio Compare To Its Peers?
We can tell from its P/E ratio of 12.77 that sentiment around Wi2Wi isn't particularly high. We can see in the image below that the average P/E (14.3) for companies in the communications industry is higher than Wi2Wi's P/E.
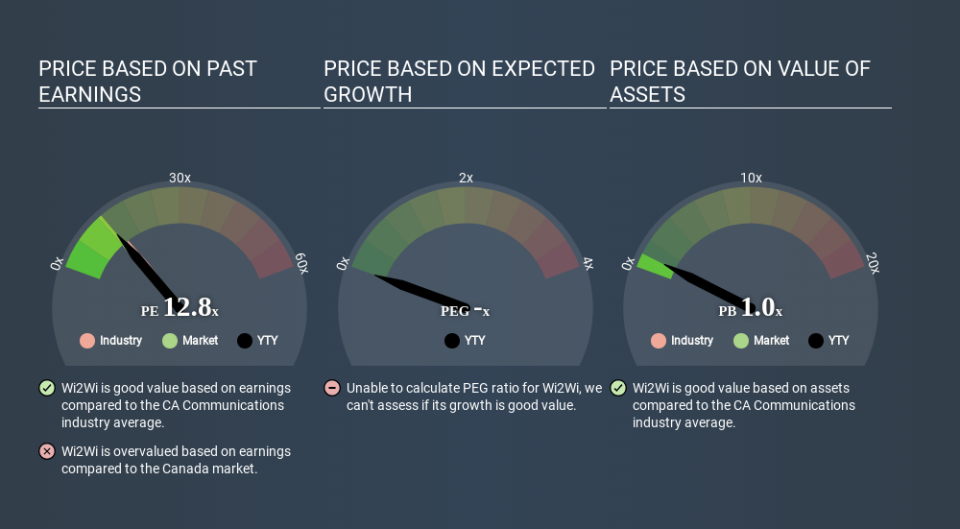
Wi2Wi's P/E tells us that market participants think it will not fare as well as its peers in the same industry. Since the market seems unimpressed with Wi2Wi, it's quite possible it could surprise on the upside. You should delve deeper. I like to check if company insiders have been buying or selling.
How Growth Rates Impact P/E Ratios
Probably the most important factor in determining what P/E a company trades on is the earnings growth. Earnings growth means that in the future the 'E' will be higher. That means even if the current P/E is high, it will reduce over time if the share price stays flat. A lower P/E should indicate the stock is cheap relative to others -- and that may attract buyers.
Wi2Wi's 276% EPS improvement over the last year was like bamboo growth after rain; rapid and impressive. And earnings per share have improved by 313% annually, over the last three years. So you might say it really deserves to have an above-average P/E ratio. Unfortunately, earnings per share are down 31% a year, over 5 years.
A Limitation: P/E Ratios Ignore Debt and Cash In The Bank
One drawback of using a P/E ratio is that it considers market capitalization, but not the balance sheet. Thus, the metric does not reflect cash or debt held by the company. Theoretically, a business can improve its earnings (and produce a lower P/E in the future) by investing in growth. That means taking on debt (or spending its cash).
Spending on growth might be good or bad a few years later, but the point is that the P/E ratio does not account for the option (or lack thereof).
How Does Wi2Wi's Debt Impact Its P/E Ratio?
With net cash of US$2.0m, Wi2Wi has a very strong balance sheet, which may be important for its business. Having said that, at 30% of its market capitalization the cash hoard would contribute towards a higher P/E ratio.
The Bottom Line On Wi2Wi's P/E Ratio
Wi2Wi's P/E is 12.8 which is about average (12.3) in the CA market. Its net cash position is the cherry on top of its superb EPS growth. So based on this analysis we'd expect Wi2Wi to have a higher P/E ratio. What is very clear is that the market has become more optimistic about Wi2Wi over the last month, with the P/E ratio rising from 9.8 back then to 12.8 today. For those who prefer to invest with the flow of momentum, that might mean it's time to put the stock on a watchlist, or research it. But the contrarian may see it as a missed opportunity.
Investors should be looking to buy stocks that the market is wrong about. As value investor Benjamin Graham famously said, 'In the short run, the market is a voting machine but in the long run, it is a weighing machine. We don't have analyst forecasts, but you might want to assess this data-rich visualization of earnings, revenue and cash flow.
Of course, you might find a fantastic investment by looking at a few good candidates. So take a peek at this free list of companies with modest (or no) debt, trading on a P/E below 20.
If you spot an error that warrants correction, please contact the editor at editorial-team@simplywallst.com. This article by Simply Wall St is general in nature. It does not constitute a recommendation to buy or sell any stock, and does not take account of your objectives, or your financial situation. Simply Wall St has no position in the stocks mentioned.
We aim to bring you long-term focused research analysis driven by fundamental data. Note that our analysis may not factor in the latest price-sensitive company announcements or qualitative material. Thank you for reading.
