
 Yahoo Finance
 A Rising Share Price Has Us Looking Closely At Newmark Group, Inc.'s (NASDAQ:NMRK) P/E Ratio

Newmark Group (NASDAQ:NMRK) shareholders are no doubt pleased to see that the share price has bounced 42% in the last month alone, although it is still down 71% over the last quarter. But that will do little to salve the savage burn caused by the 58% share price decline, over the last year.
Assuming no other changes, a sharply higher share price makes a stock less attractive to potential buyers. While the market sentiment towards a stock is very changeable, in the long run, the share price will tend to move in the same direction as earnings per share. The implication here is that deep value investors might steer clear when expectations of a company are too high. One way to gauge market expectations of a stock is to look at its Price to Earnings Ratio (PE Ratio). A high P/E ratio means that investors have a high expectation about future growth, while a low P/E ratio means they have low expectations about future growth.
View our latest analysis for Newmark Group
Does Newmark Group Have A Relatively High Or Low P/E For Its Industry?
We can tell from its P/E ratio of 6.03 that sentiment around Newmark Group isn't particularly high. The image below shows that Newmark Group has a lower P/E than the average (18.1) P/E for companies in the real estate industry.
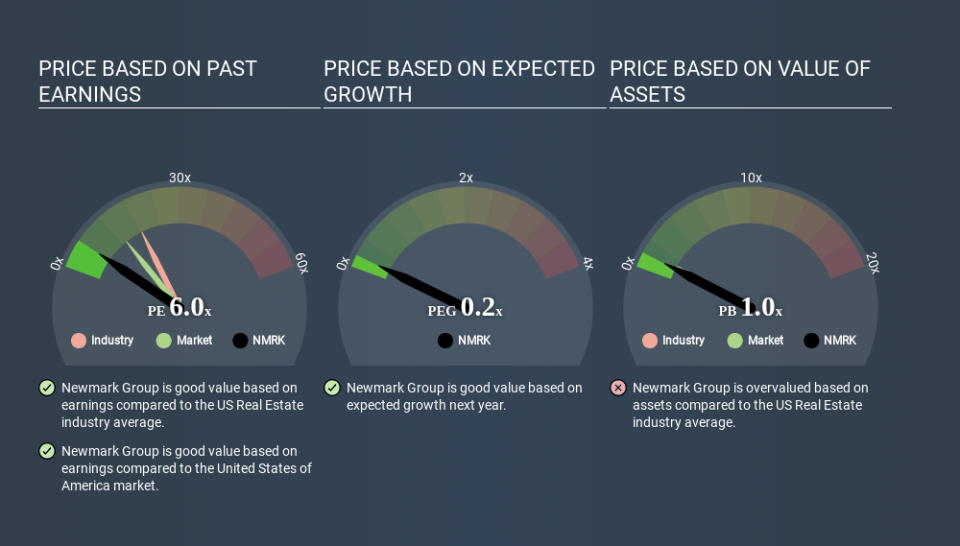
Newmark Group's P/E tells us that market participants think it will not fare as well as its peers in the same industry. Since the market seems unimpressed with Newmark Group, it's quite possible it could surprise on the upside. If you consider the stock interesting, further research is recommended. For example, I often monitor director buying and selling.
How Growth Rates Impact P/E Ratios
P/E ratios primarily reflect market expectations around earnings growth rates. When earnings grow, the 'E' increases, over time. That means unless the share price increases, the P/E will reduce in a few years. A lower P/E should indicate the stock is cheap relative to others -- and that may attract buyers.
Newmark Group's earnings per share fell by 9.1% in the last twelve months.
Don't Forget: The P/E Does Not Account For Debt or Bank Deposits
The 'Price' in P/E reflects the market capitalization of the company. In other words, it does not consider any debt or cash that the company may have on the balance sheet. The exact same company would hypothetically deserve a higher P/E ratio if it had a strong balance sheet, than if it had a weak one with lots of debt, because a cashed up company can spend on growth.
Such expenditure might be good or bad, in the long term, but the point here is that the balance sheet is not reflected by this ratio.
Newmark Group's Balance Sheet
Newmark Group has net debt worth 71% of its market capitalization. This is enough debt that you'd have to make some adjustments before using the P/E ratio to compare it to a company with net cash.
The Bottom Line On Newmark Group's P/E Ratio
Newmark Group's P/E is 6.0 which is below average (13.2) in the US market. Given meaningful debt, and a lack of recent growth, the market looks to be extrapolating this recent performance; reflecting low expectations for the future. What is very clear is that the market has become less pessimistic about Newmark Group over the last month, with the P/E ratio rising from 4.3 back then to 6.0 today. For those who like to invest in turnarounds, that might mean it's time to put the stock on a watchlist, or research it. But others might consider the opportunity to have passed.
Investors should be looking to buy stocks that the market is wrong about. If it is underestimating a company, investors can make money by buying and holding the shares until the market corrects itself. So this free visual report on analyst forecasts could hold the key to an excellent investment decision.
But note: Newmark Group may not be the best stock to buy. So take a peek at this free list of interesting companies with strong recent earnings growth (and a P/E ratio below 20).
If you spot an error that warrants correction, please contact the editor at editorial-team@simplywallst.com. This article by Simply Wall St is general in nature. It does not constitute a recommendation to buy or sell any stock, and does not take account of your objectives, or your financial situation. Simply Wall St has no position in the stocks mentioned.
We aim to bring you long-term focused research analysis driven by fundamental data. Note that our analysis may not factor in the latest price-sensitive company announcements or qualitative material. Thank you for reading.
