
 Yahoo Finance
 A Rising Share Price Has Us Looking Closely At Perficient, Inc.'s (NASDAQ:PRFT) P/E Ratio

Those holding Perficient (NASDAQ:PRFT) shares must be pleased that the share price has rebounded 46% in the last thirty days. But unfortunately, the stock is still down by 30% over a quarter. However, the annual gain of 8.6% wasn't so impressive.
All else being equal, a sharp share price increase should make a stock less attractive to potential investors. While the market sentiment towards a stock is very changeable, in the long run, the share price will tend to move in the same direction as earnings per share. So some would prefer to hold off buying when there is a lot of optimism towards a stock. One way to gauge market expectations of a stock is to look at its Price to Earnings Ratio (PE Ratio). A high P/E implies that investors have high expectations of what a company can achieve compared to a company with a low P/E ratio.
Check out our latest analysis for Perficient
Does Perficient Have A Relatively High Or Low P/E For Its Industry?
Perficient's P/E is 29.41. As you can see below Perficient has a P/E ratio that is fairly close for the average for the it industry, which is 29.8.
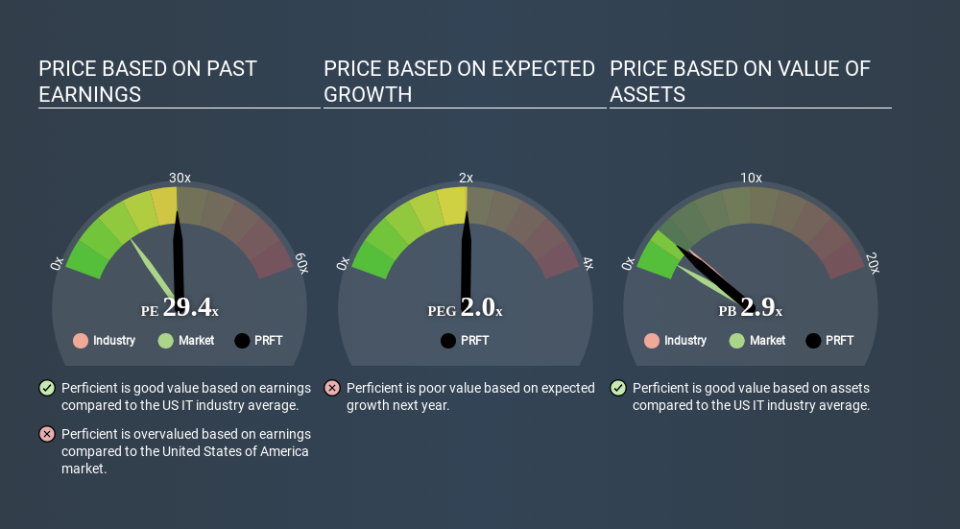
Perficient's P/E tells us that market participants think its prospects are roughly in line with its industry. So if Perficient actually outperforms its peers going forward, that should be a positive for the share price. Further research into factors such as insider buying and selling, could help you form your own view on whether that is likely.
How Growth Rates Impact P/E Ratios
P/E ratios primarily reflect market expectations around earnings growth rates. If earnings are growing quickly, then the 'E' in the equation will increase faster than it would otherwise. Therefore, even if you pay a high multiple of earnings now, that multiple will become lower in the future. And as that P/E ratio drops, the company will look cheap, unless its share price increases.
Perficient's earnings made like a rocket, taking off 56% last year. Even better, EPS is up 25% per year over three years. So we'd absolutely expect it to have a relatively high P/E ratio.
A Limitation: P/E Ratios Ignore Debt and Cash In The Bank
One drawback of using a P/E ratio is that it considers market capitalization, but not the balance sheet. So it won't reflect the advantage of cash, or disadvantage of debt. Hypothetically, a company could reduce its future P/E ratio by spending its cash (or taking on debt) to achieve higher earnings.
Spending on growth might be good or bad a few years later, but the point is that the P/E ratio does not account for the option (or lack thereof).
How Does Perficient's Debt Impact Its P/E Ratio?
Net debt totals just 4.7% of Perficient's market cap. So it doesn't have as many options as it would with net cash, but its debt would not have much of an impact on its P/E ratio.
The Verdict On Perficient's P/E Ratio
Perficient's P/E is 29.4 which is above average (14.9) in its market. The company is not overly constrained by its modest debt levels, and its recent EPS growth is nothing short of stand-out. So on this analysis a high P/E ratio seems reasonable. What is very clear is that the market has become significantly more optimistic about Perficient over the last month, with the P/E ratio rising from 20.2 back then to 29.4 today. For those who prefer to invest with the flow of momentum, that might mean it's time to put the stock on a watchlist, or research it. But the contrarian may see it as a missed opportunity.
Investors have an opportunity when market expectations about a stock are wrong. People often underestimate remarkable growth -- so investors can make money when fast growth is not fully appreciated. So this free visual report on analyst forecasts could hold the key to an excellent investment decision.
But note: Perficient may not be the best stock to buy. So take a peek at this free list of interesting companies with strong recent earnings growth (and a P/E ratio below 20).
If you spot an error that warrants correction, please contact the editor at editorial-team@simplywallst.com. This article by Simply Wall St is general in nature. It does not constitute a recommendation to buy or sell any stock, and does not take account of your objectives, or your financial situation. Simply Wall St has no position in the stocks mentioned.
We aim to bring you long-term focused research analysis driven by fundamental data. Note that our analysis may not factor in the latest price-sensitive company announcements or qualitative material. Thank you for reading.
