
 Yahoo Finance
 Returns Are Gaining Momentum At Journey Energy (TSE:JOY)
If you're not sure where to start when looking for the next multi-bagger, there are a few key trends you should keep an eye out for. Amongst other things, we'll want to see two things; firstly, a growing return on capital employed (ROCE) and secondly, an expansion in the company's amount of capital employed. Put simply, these types of businesses are compounding machines, meaning they are continually reinvesting their earnings at ever-higher rates of return. So when we looked at Journey Energy (TSE:JOY) and its trend of ROCE, we really liked what we saw.
Return On Capital Employed (ROCE): What Is It?
Just to clarify if you're unsure, ROCE is a metric for evaluating how much pre-tax income (in percentage terms) a company earns on the capital invested in its business. The formula for this calculation on Journey Energy is:
Return on Capital Employed = Earnings Before Interest and Tax (EBIT) ÷ (Total Assets - Current Liabilities)
0.14 = CA$73m ÷ (CA$639m - CA$128m) (Based on the trailing twelve months to December 2022).
Thus, Journey Energy has an ROCE of 14%. In isolation, that's a pretty standard return but against the Oil and Gas industry average of 21%, it's not as good.
View our latest analysis for Journey Energy
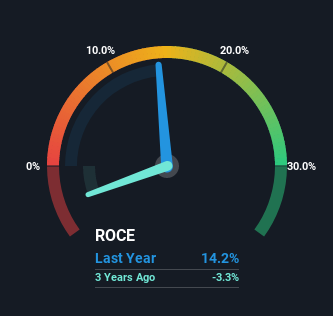
Above you can see how the current ROCE for Journey Energy compares to its prior returns on capital, but there's only so much you can tell from the past. If you're interested, you can view the analysts predictions in our free report on analyst forecasts for the company.
How Are Returns Trending?
We're delighted to see that Journey Energy is reaping rewards from its investments and is now generating some pre-tax profits. The company was generating losses five years ago, but now it's earning 14% which is a sight for sore eyes. And unsurprisingly, like most companies trying to break into the black, Journey Energy is utilizing 64% more capital than it was five years ago. We like this trend, because it tells us the company has profitable reinvestment opportunities available to it, and if it continues going forward that can lead to a multi-bagger performance.
In Conclusion...
Long story short, we're delighted to see that Journey Energy's reinvestment activities have paid off and the company is now profitable. Since the stock has returned a staggering 295% to shareholders over the last five years, it looks like investors are recognizing these changes. Therefore, we think it would be worth your time to check if these trends are going to continue.
If you want to know some of the risks facing Journey Energy we've found 3 warning signs (2 can't be ignored!) that you should be aware of before investing here.
For those who like to invest in solid companies, check out this free list of companies with solid balance sheets and high returns on equity.
Have feedback on this article? Concerned about the content? Get in touch with us directly. Alternatively, email editorial-team (at) simplywallst.com.
This article by Simply Wall St is general in nature. We provide commentary based on historical data and analyst forecasts only using an unbiased methodology and our articles are not intended to be financial advice. It does not constitute a recommendation to buy or sell any stock, and does not take account of your objectives, or your financial situation. We aim to bring you long-term focused analysis driven by fundamental data. Note that our analysis may not factor in the latest price-sensitive company announcements or qualitative material. Simply Wall St has no position in any stocks mentioned.
Join A Paid User Research Session
You’ll receive a US$30 Amazon Gift card for 1 hour of your time while helping us build better investing tools for the individual investors like yourself. Sign up here
